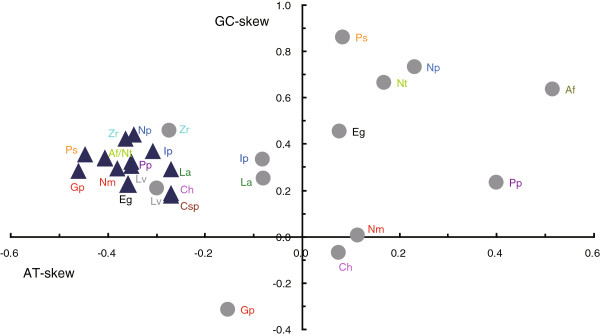
Figure 2.

Scatter plot of AT- and GC-skews in 14 nemertean species. Values were calculated for the coding strand of the overall mitogenome sequences (▲) and the major non-coding region (Cephalothrix sp. not included because the major non-coding region of this species is incomplete) (●). AT-skew = (A-T)/(A + T); GC-skew = (G-C)/(G + C). Af = Amphiporus formidabilis, Ch = Cephalothrix hongkongiensis, Csp = Cephalothrix sp., Eg = Emplectonema gracile, Ip = Iwatanemertes piperata, Gp = Gononemertes parasita, Lv = Lineus viridis, La = Lineus alborostratus, Nt = Nemertopsis tetraclitophila, Np = Nipponnemertes punctatula, Nm = Nectonemertes cf. mirabilis, Ps = Prosadenoporus spectaculum, Pp = Paranemertes cf. peregrina, Zr = Zygeupolia rubens.
