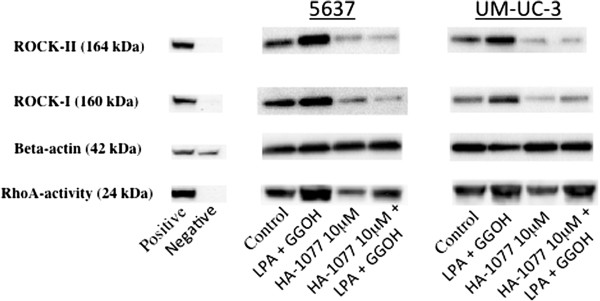
Figure 3.

Representative bands identified by Western blotting in 5637 and UM-UC-3 cells. Expression of RhoA (24 kDa), ROCK-I (160 kDa), ROCK-II (164 kDa), and beta-actin (42 kDa). Hela cells were used as the positive control. In both cancer cells, LPA plus GGOH induced upregulation of RhoA activity, ROCK-I and ROCK-II. While HA-1077 significantly decreased ROCK-I and ROCK-II expression, this inhibitory effect of HA-1077 was not blocked by addition of LPA plus GGOH. HA-1077 did not influence RhoA activity.
