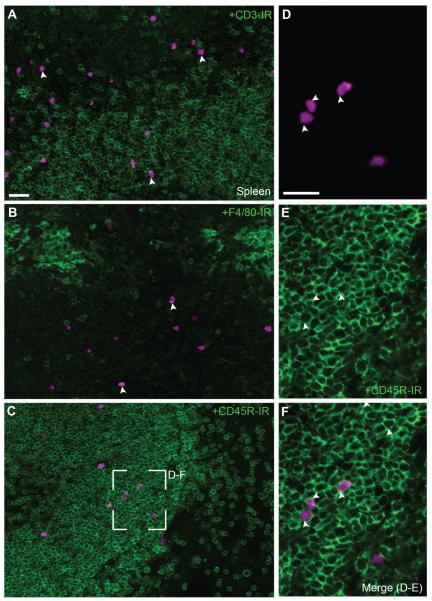
Figure 12.
Phenotyping of immune cells in the spleen. A: Although fluorescently labeled immune cells were present in T-cell areas, they rarely colocalized with markers for T-cells (20×, 8 optical plans, 1.48- μm step). B: Macrophages stained with F4/80 (green) tended to accumulated in the marginal zone and never colocalized with tdTomato (20×, 8 optical plans, 1.48- μm step). C: In contrast, fluorescent immune cells distributed in B-cells areas (20×, 8 optical plans, 1.48- μm step). D–F: TdTomato cells were frequently positive for CD45R (403×, 4 optical plans, 0.84- μm step). Of note, markers for immune cells (green) preferentially stained the cell surface rather than the cytoplasm. Arrowheads point to representative cell bodies with cytoplasmic tdTomato. Scale bar = 20 μm in A (applies to A–C); 20 μm in D (applies to D–F).

