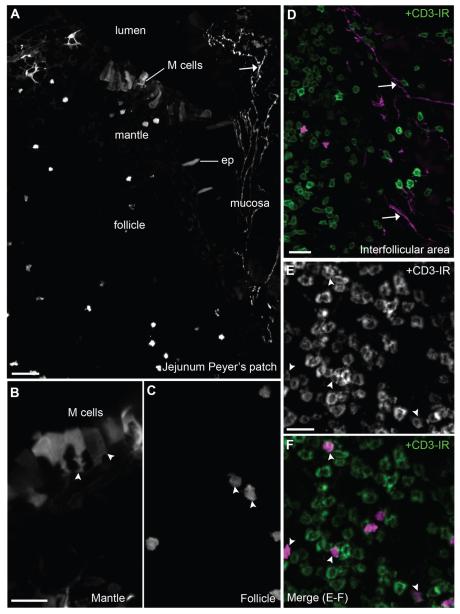
Figure 9.
Cholinergic structures in the Peyer’s patches. A: Distinct epithelial, immune, and neuronal fluorescent structures were visualized in Peyer’s patches. Cells resembling dendritic cells were inconsistently noticed in the dome (10×, 5 optical plans, 5.57-μm step). B: Notably, clusters of M cells were seen at the top of the dome (40×, 6 optical plans, 0.68-μm step). These cells display a typical pocket-like structure toward the mantle. C,D: Cells resembling lymphocytes were noticed in the follicle (40×, 6 optical plans, 0.68-μm step) and interfollicular areas (20×, 6 optical plans, 1.6-μm step). The innervation to Peyer’s patches was confined to the interfollicular areas. E,F: CD3 immunoreactivity was frequently found in tdTomato-containing immune cells (40×, 5 optical plans, 0.94-μm step). CD3-positive cells (green or white) are labeled in D, E, and F. Arrows indicate fluorescently labeled neuronal fibers and arrowheads point to representative cell bodies. Abbreviations: ep, epithelium; M cell, microfold cell. Scale bar = 40 μm in A; 20 μm in B (applies to B,C), D, and E (applies to E,F).

