
Figure 10.
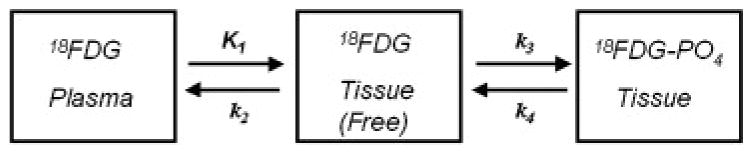
Kinetic model for 18FDG transport and metabolism. When 18FDG is injected, it is transported from plasma into cells according to the rate constant K1, transported back into plasma with rate constant k2, phosphorylated with rate constant k3 and dephosphorylated with rate constant k4. For BAT there is minimal dephosphorylation and k4 is close to zero.