
Figure 3.
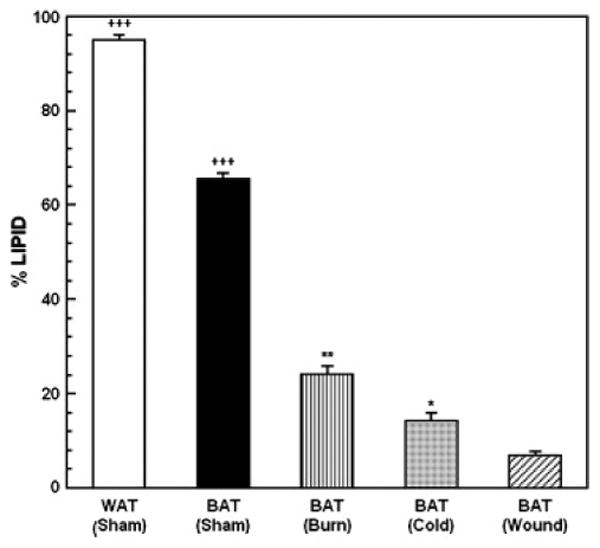
Percent lipid content of WAT and BAT from sham control animals and BAT from mice subjected to burn injury, cutaneous wound and cold stress. Each value is the mean ± sem for 6 animals. ***p<0.001 vs. all other groups, +++p<0.0001 vs. BAT in mice with burn injury, cold-stress and cutaneous wound, **p<0.01 vs. mice with cold-stress and cutaneous wound, *p<0.05 vs. mice with cutaneous wound.