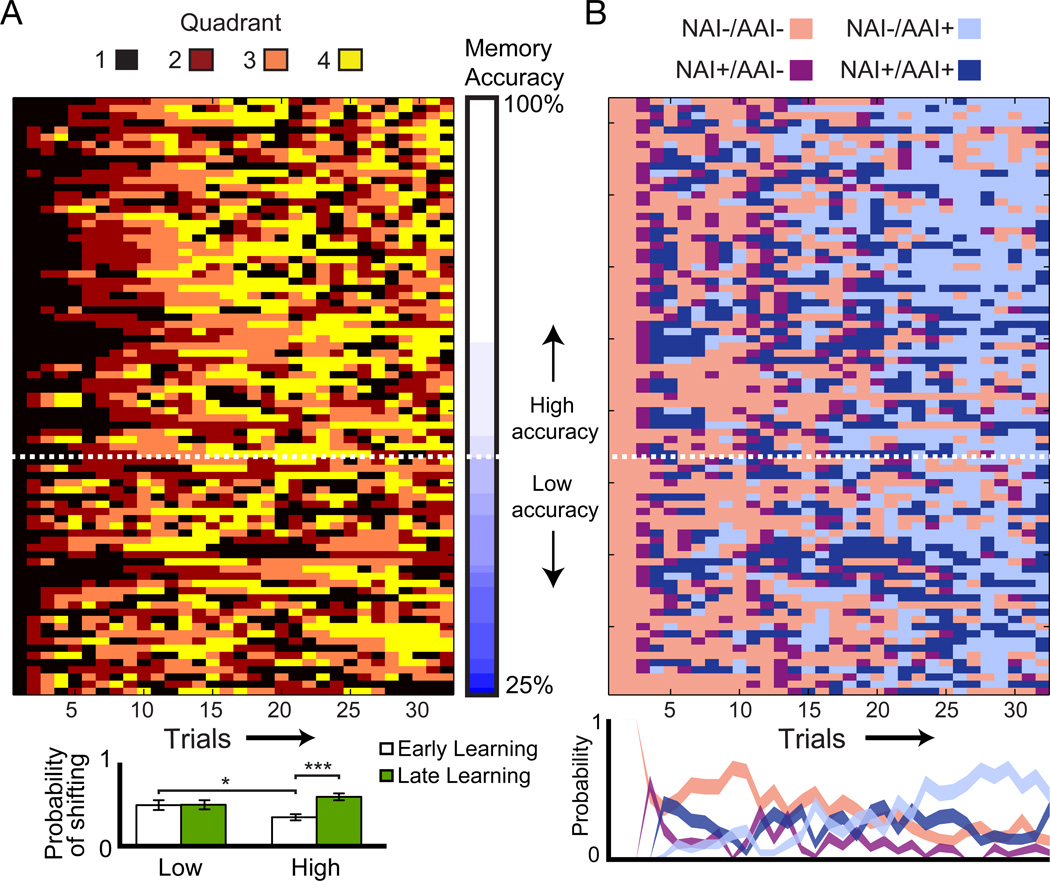
Figure 3. Patterns of exploration decisions and concomitant contextual information.
(A) Patterns of quadrant visits for all subjects, ordered by test accuracy. The dotted line represents cutoff for high versus low accuracy (80%; see Experimental Procedures). Quadrants 1, 2, 3, and 4 indicate the 1st, 2nd, 3rd, and 4th quadrants visited by each subject, not an indication of the absolute quadrants visited. The bar graph (bottom) shows mean probability of shifting quadrants for both accuracy groups (Low and High) in early and late Learning. (B) Sequence of the four information trial types ordered as in A. The line graph (bottom) shows the histogram of the four trial types over time, averaged over all runs. Error bars represent standard error of the mean (s.e.m.). Line thickness represents point-by-point s.e.m. * p < 0.05, ***p < 0.001.

