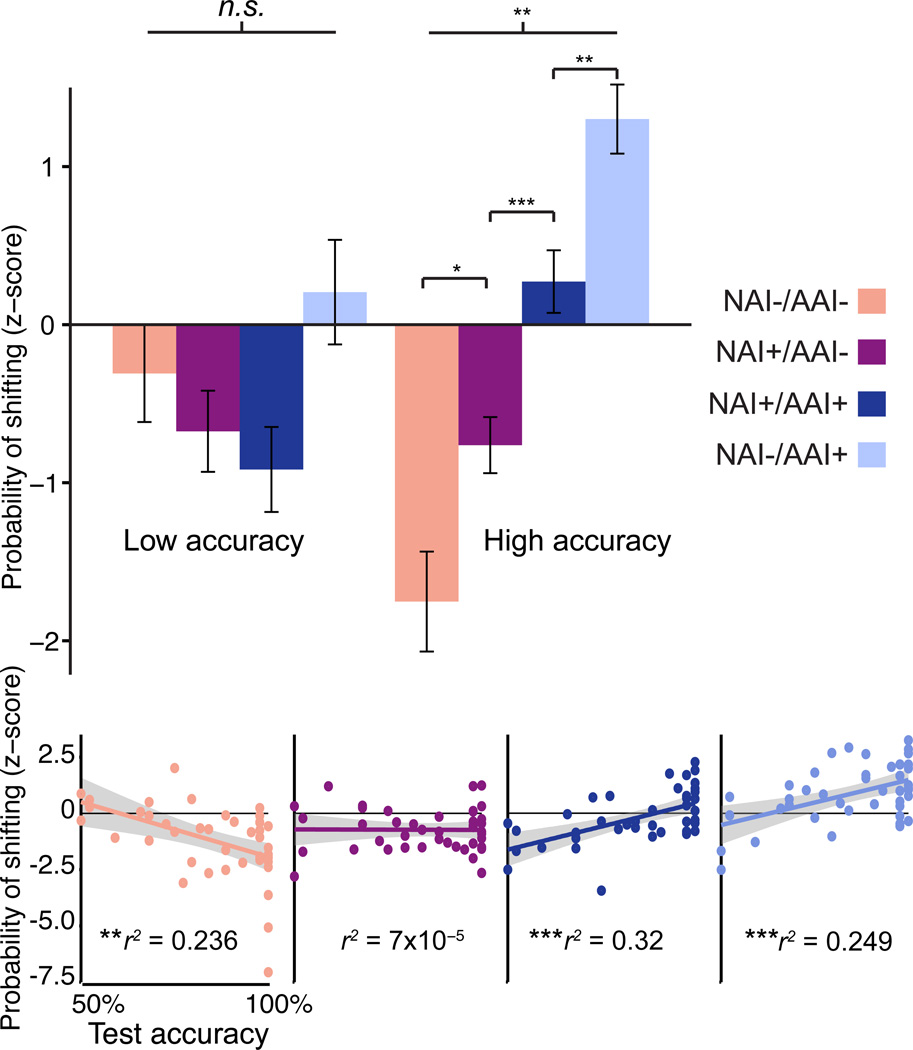
Figure 4. Information-based shift/stay decisions.
(A) Probability of shifting quadrants during Active Learning (Z-score, calculated relative to simulated random chance, see Experimental Procedures) for each information trial type, for low-accuracy subjects and high-accuracy subjects (see also Figure S1). (B) Probability of shifting quadrants plotted versus test accuracy for each information trial type. Background shading on linear fits represents 95% confidence intervals. Error bars represent s.e.m. * p < 0.05, **p < 0.01, ***p < 0.001.

