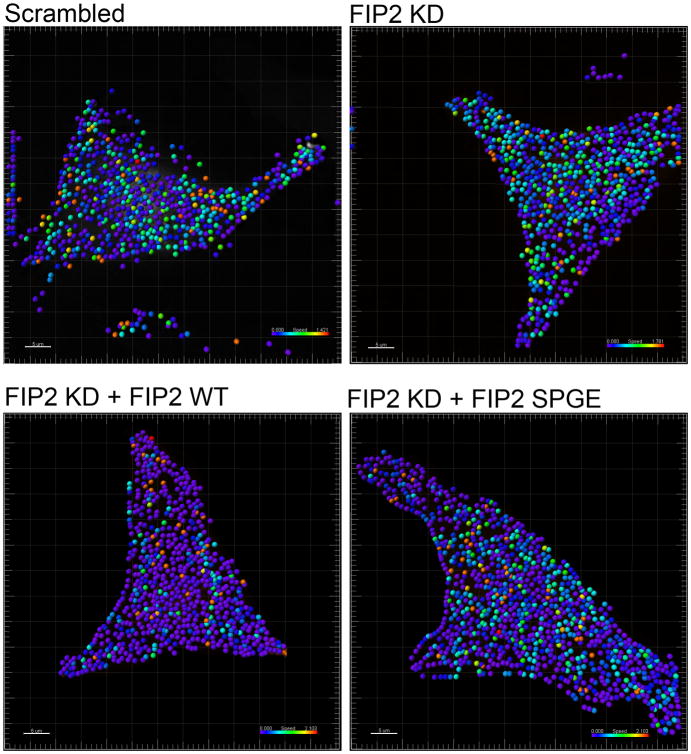
Figure 7. Non-motile vesicle populations are distributed randomly throughout the cell.
mCherry-Rab11a vesicles were tracked by Imaris software for vesicle speed and displayed across the cell. The vesicles were color-coded for speed with blue being the slowest and red being the fastest. Each image is representative of at least 3 cells.

