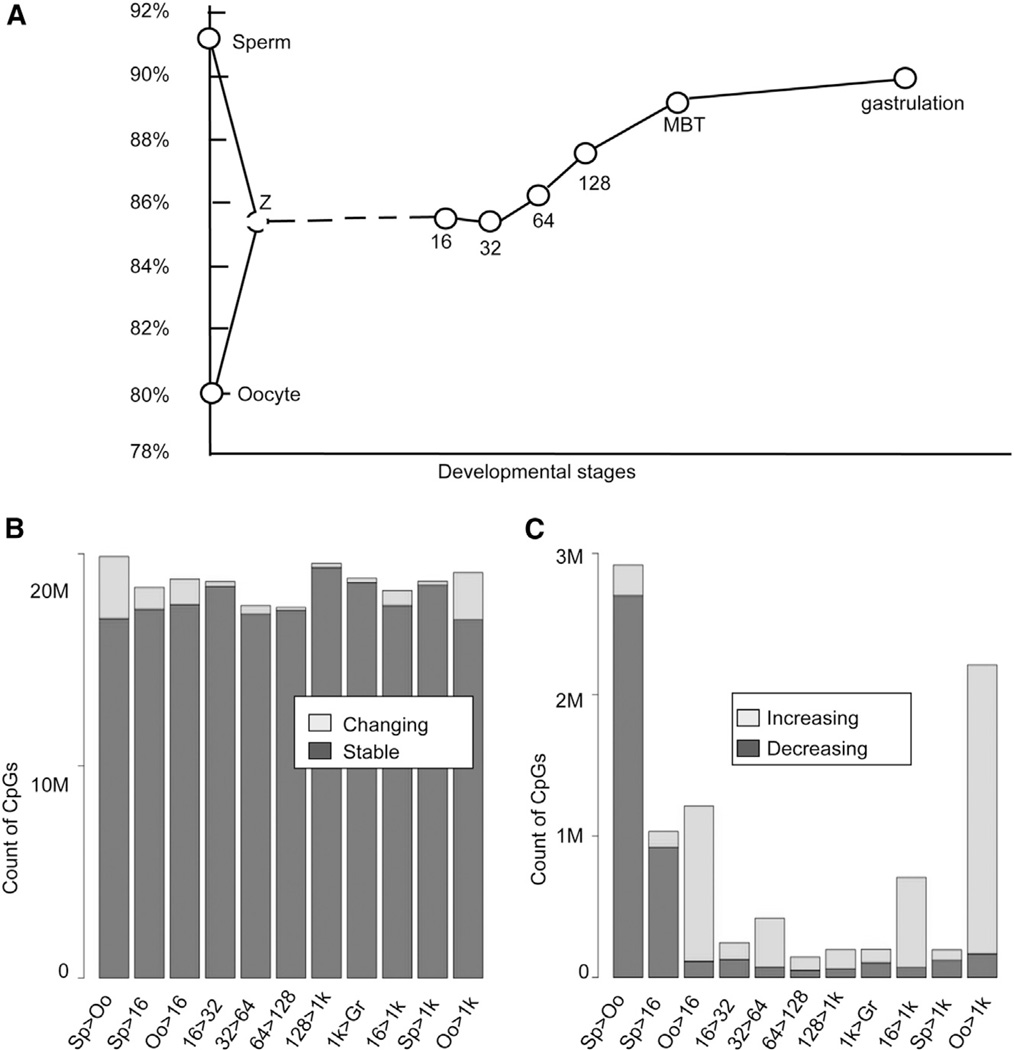
Figure 1. Dynamics of DNA Methylomes for Gametes and Early Embryos.
(A) The dynamics of the average DNA methylation level. The average methylation level is calculated as the percentage of methylated CpG in all CpG content. “Z” means the mean of methylation level between oocyte and sperm.
(B) Differentially methylated CpG sites between consecutive stages.
(C) Sites with increasing or decreasing methylation levels co-occur during each consecutive transition. The last two bars represent the comparisons between sperm or oocyte with the 1,000-cell stage, respectively.
See also Figure S1.

