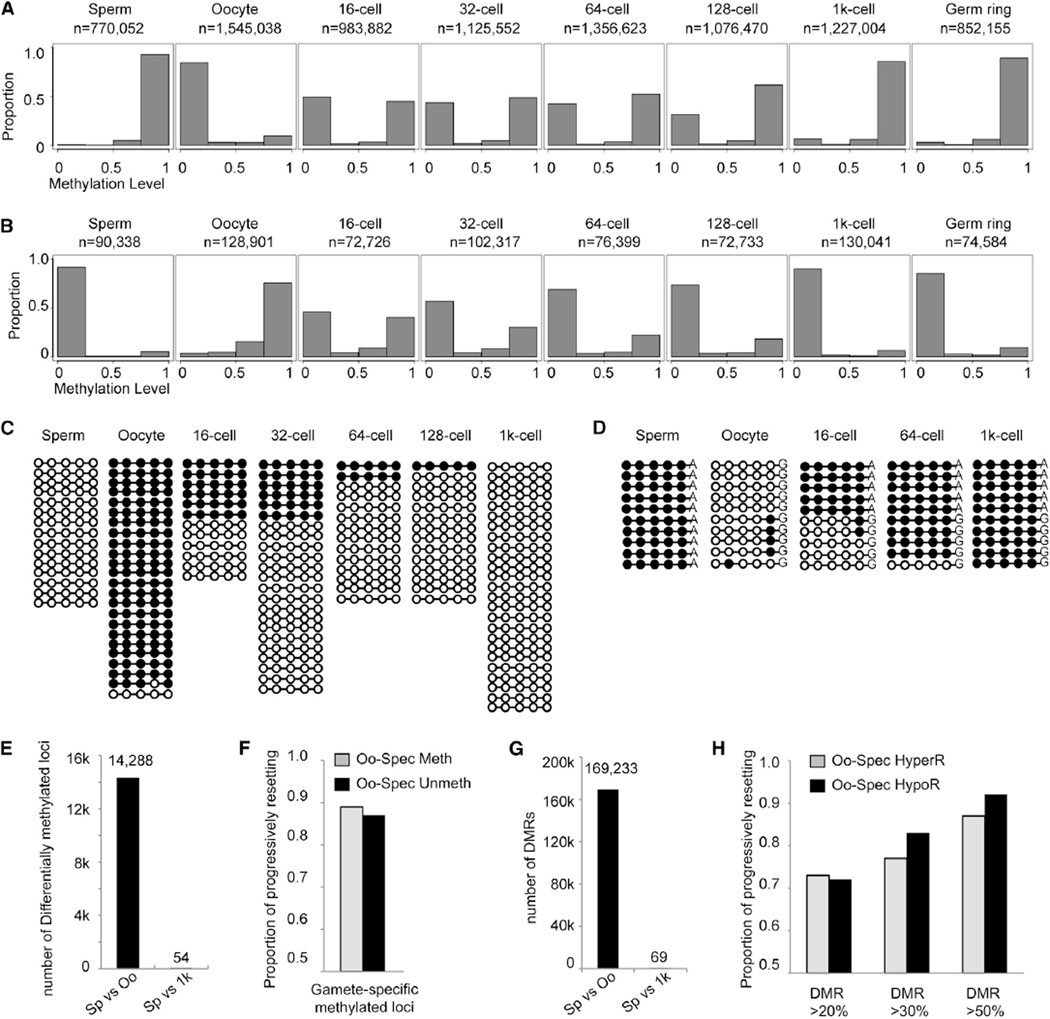
Figure 3. The Methylome of Paternal DNA Is Maintained, and the Methylome of Maternal DNA Is Gradually Reset to Sperm Pattern.
(A) Distribution of the average methylation values of paired reads, which include at least four consecutive oocyte-specific unmethylated CpG sites (mCpG percentage ≥ 75% in sperm and ≤ 25% in oocyte) in gametes and early embryos. n is the number of paired reads in each stage.
(B) Distribution of average methylation values of paired reads covering at least four consecutive oocyte-specific methylated sites (mCpG percentage ≥ 75% in oocyte and ≤ 25% in sperm). x axis represents methylation level. Bins are at 0.25 intervals (bins at 0.05 are shown in Figures S1C and S1D).
(C) Dynamic changes of DNA methylation for a representative locus located in chr7:21,315,648-21,315,662. Paired reads from whole-genome data covering all five CpGs are shown. Open circles represent unmethylated CpGs, and filled circles represent methylated CpGs.
(D) Dynamic changes of DNA methylation for a representative locus in chr6: 27,393,375-27,393,560 tracked with SNPs to distinguish maternal and paternal DNA. The data are validated using bisulfite PCR. Ten reads were randomly picked for sperm and oocyte. Five reads from paternal DNA and five reads from maternal DNA are randomly picked in 16-cell, 64-cell, and 1,000-cell stages of embryos. See also Table S4.
(E) Number of differentially methylated loci covered by oocyte-specific methylated and unmethylated paired reads.
(F) Genome-wide analysis of the proportion of differentially methylated loci covered by paired reads progressively resetting to sperm methylation state. Gray bars represent oocyte-specific hypermethylated loci, and black bars represent oocyte-specific hypomethylated loci.
(G) Number of DMRs genome wide, methylation difference > 0.2.
(H) Genome-wide analysis of the proportion of DMRs progressively resetting to sperm methylation state. Methylation level difference of the DMRs was set higher than 0.2, 0.3, and 0.5, respectively.
See also Figures S3 and S4 and Tables S2 and S3.

