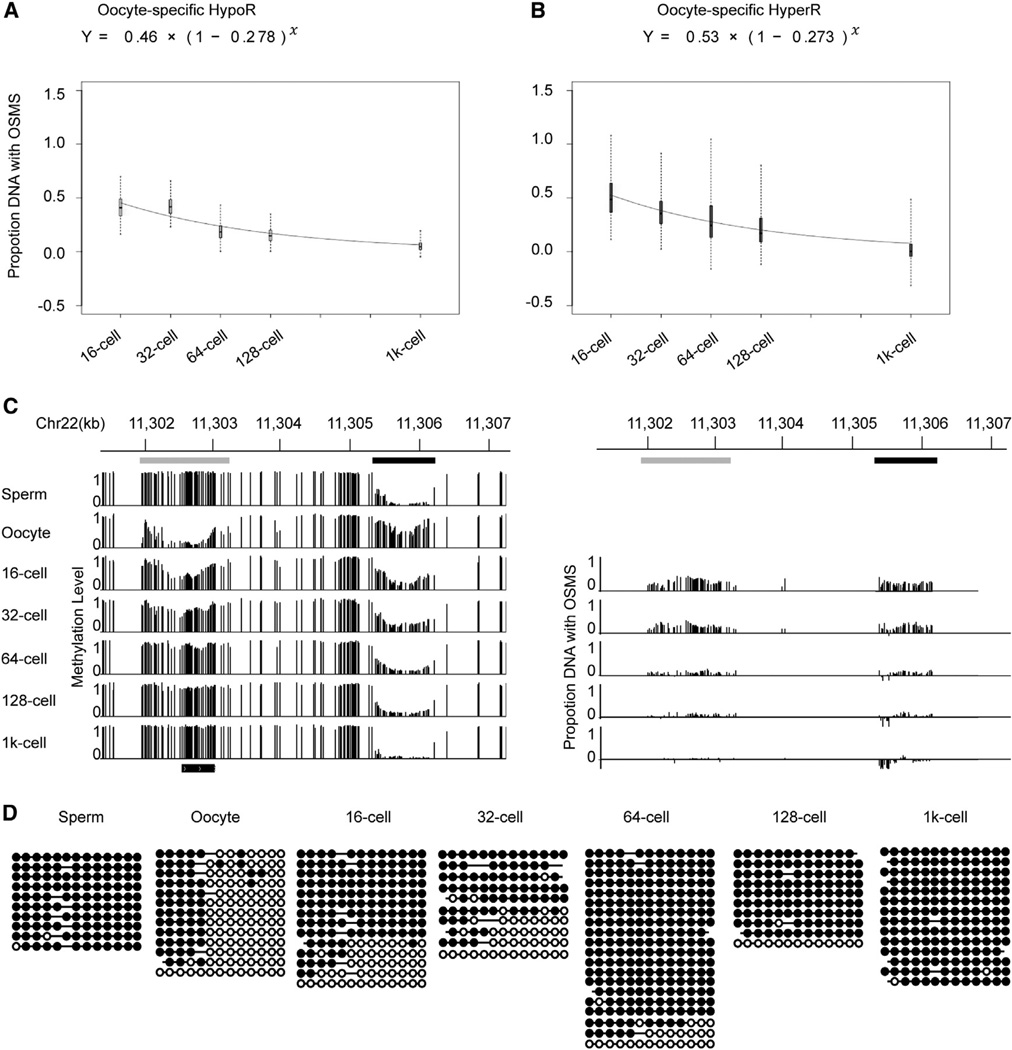
Figure 4. DNA Demethylation Rate of Oocyte-Specific HypoRs and De Novo Methylation Rate of HyperRs.
(A and B) Fitting curves of the DNA demethylation rate of oocyte-specific HypoRs and de novo methylation rate of HyperRs. The methylation level difference of HypoRs and HyperRs is greater than 0.2. HypoRs and HyperRs represent hypomethylated and hypermethylated regions versus sperm, respectively. OSMS represents oocyte-specific methylation state, which is compared with sperm. Box plot of proportion DNA with OSMS was drawn for each stage. Black line indicates median, edges stand for the 25th/75th percentile, and whiskers represent the 2.5th/97.5th percentile.
(C) Graphical representation of methylation dynamics of one region containing one oocyte-specific HyperR (demethylation locus, black bar) and one oocyte-specific HypoR (de novo methylation locus, gray bar). The left panel shows the dynamics of the methylation level. The right panel shows the relative proportion of DNA copies with oocyte methylation state for each CG site within the DMRs.
(D) Dynamics of a representative locus in chr16: 46,387,770-46,387,944 covered by paired reads containing common methylated sites and differentially methylated sites (sperm versus oocyte). Paired reads with oocyte methylation landscape decrease and reprogram to sperm methylation state.
See also Table S5.

