Figure 3.
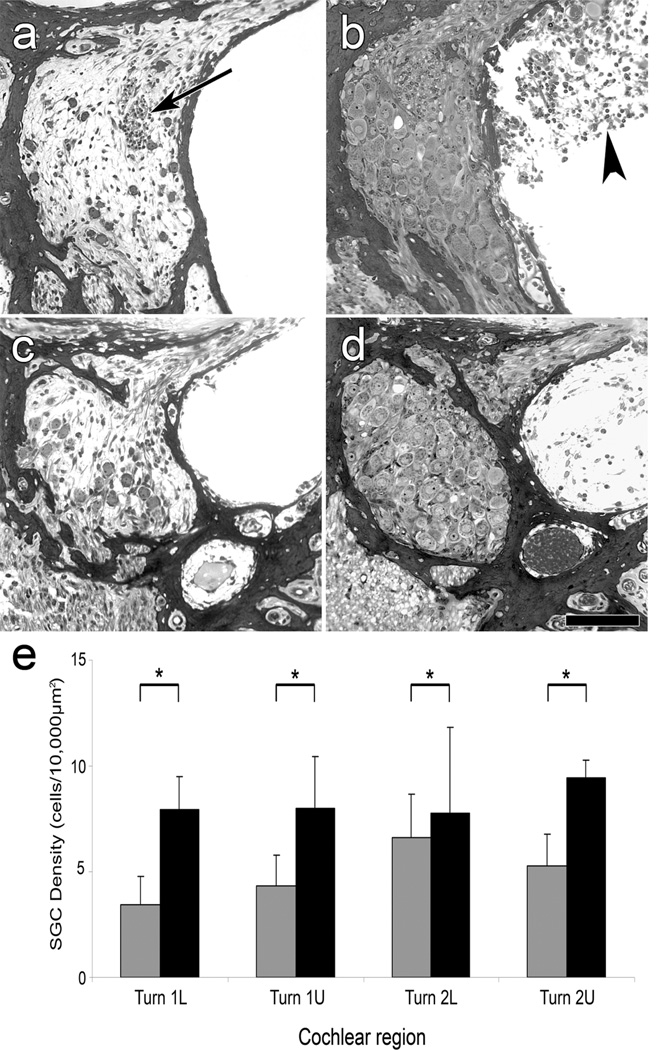
Light microscope micrographs of plastic sections through Rosenthal’s canal in the 1st (a and b) and 2nd (c and d) cochlear turns 14 days after inoculation of Ad.Empty (a and c), or Ad.BDNF (b and d), and quantification of SGNs (e). (a and c) SGNs are scarce. A presumed efferent fiber bundle is present (arrow in a). (b and d) Rosenthal’s canal in Ad.BDNF inoculated ears exhibits a confluent population of neurons and no gliotic areas. In some of the Ad.BDNF inoculated ears, connective tissue could be observed in the scala tympani (arrow head in b). Scale bar=100 µm. (e) Mean SGN density among the cochlear regions of basal and 2nd turn of Ad.Empty and Ad.BDNF inoculated animals. Comparison of SGN density in Ad.Empty (gray bars) and Ad.BDNF (black bars) inoculated groups in all regions showed significantly larger numbers of surviving SGN in the Ad.BDNF groups. Error bars are standard deviations. Statistical comparison was by one-way ANOVA. (*) indicates p<0.01; L=Lower; U=Upper. (Reprinted with permission from Shibata et al., 2010)

