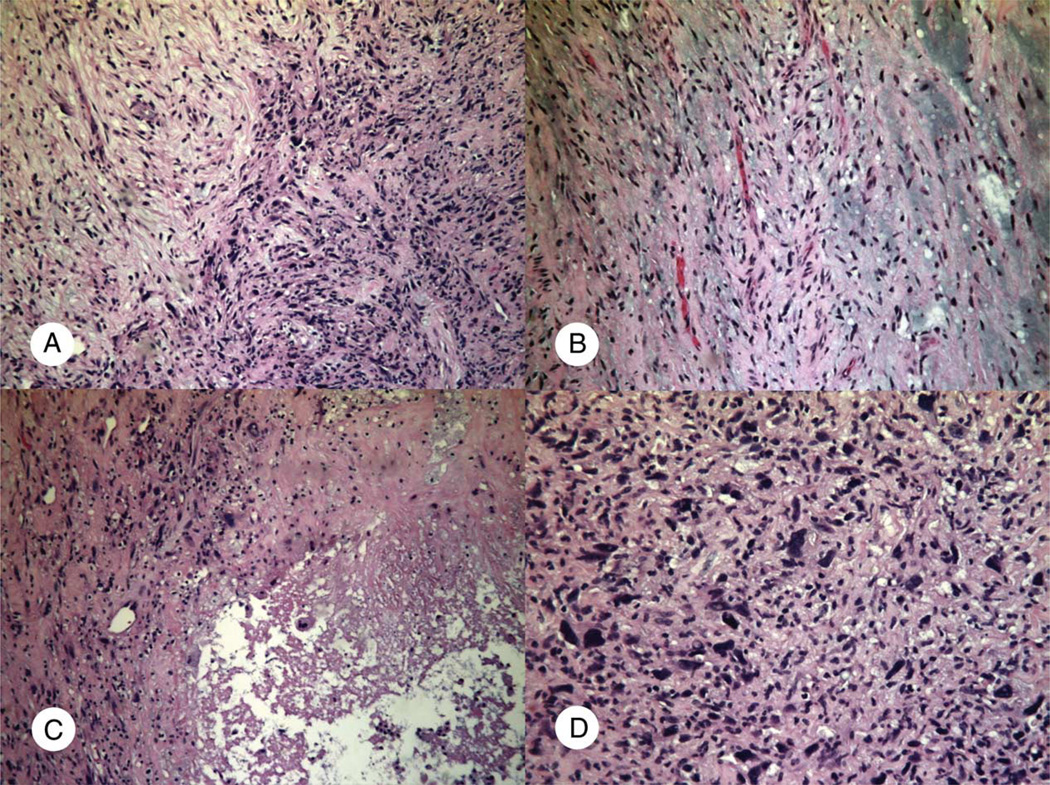
Fig. 3.
High-grade myxofibrosarcoma (case 4; Table 1). A, Interface of the high-grade and low-grade areas to show difference in cellularity and nuclear pleomorphism. B, Hypocellular area with curvilinear vasculature and myxoid stroma. C and D, High-grade areas with necrosis (C) and higher cellularity and marked nuclear pleomorphism (D) (A, B, and C: H&E ×100; D: H&E ×200).

