
Figure 3.
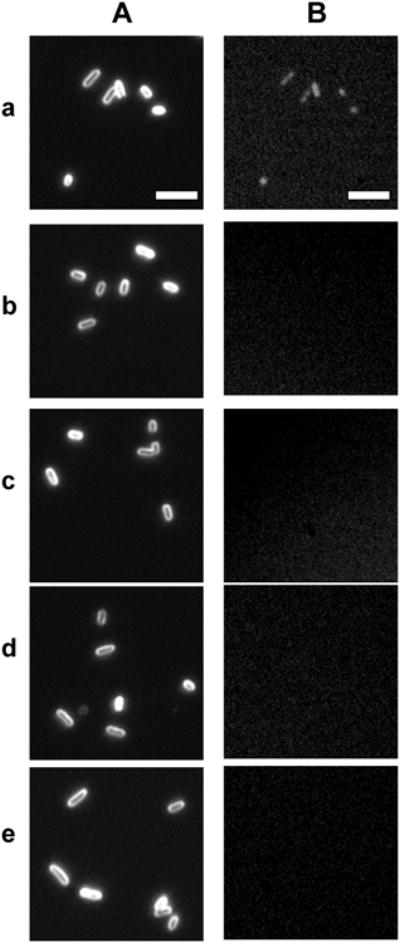
Characterization of expression of egfp-mexB fusion gene in single live cells. (A) Dark-field optical images and (B) green fluorescence images of single live cells: (a) MexA-(EGFP-MexB)-OprM; (b) ΔMexB; (c) WT; (d) nalB1; and (e) ΔABM, show green fluorescence of EGFP in (a) MexA-(EGFP-MexB)-OprM cells only, which indicates the expression of egfp-mexB fusion gene in the cells. Scale bar = 5 μm.