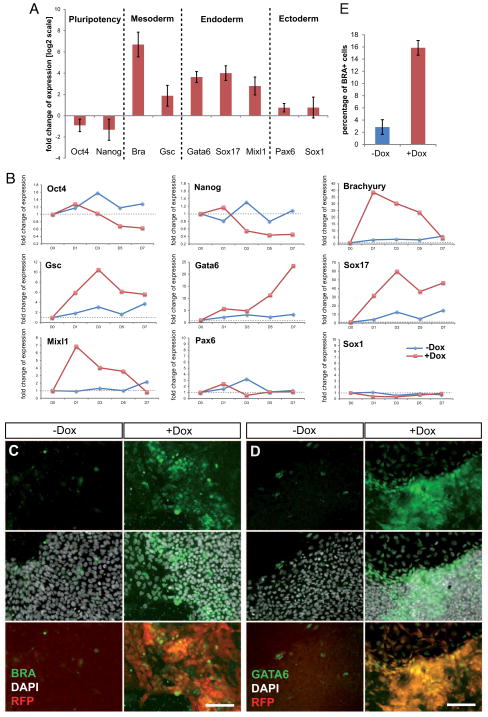
Figure 3. Overexpression of miR-373 in hESCs leads to mesendodermal differentiation.
(A) Real-Time qPCR analysis of gene expression was performed on induced (+Dox) and uninduced (−Dox) TT-miR-373 cells at day 5. Data are shown here as fold-change of expression (on a log2 scale) in +Dox compared to −Dox cells, and represent average values from three biological replicates ±s.dev. (B) Real-Time qPCR analysis of gene expression over the course of seven days of mir-373 overexpression (D0 to D7). Data are represented as relative quantification to D0. Note different scales on y axes for each gene. (C, D) TT-miR-373 cells were left untreated (−Dox) or induced with doxycycline (+Dox) for five (for BRA) or seven (for GATA6) days and stained with an anti-BRA (C) or anti-GATA6 (D) antibody. DAPI was used for nuclear staining; reporter RFP was also visualized. Scale bars: 100μm. (E) Quantification of BRA+ TT-miR-373 cells after 5 days of mir-373 overexpression.

