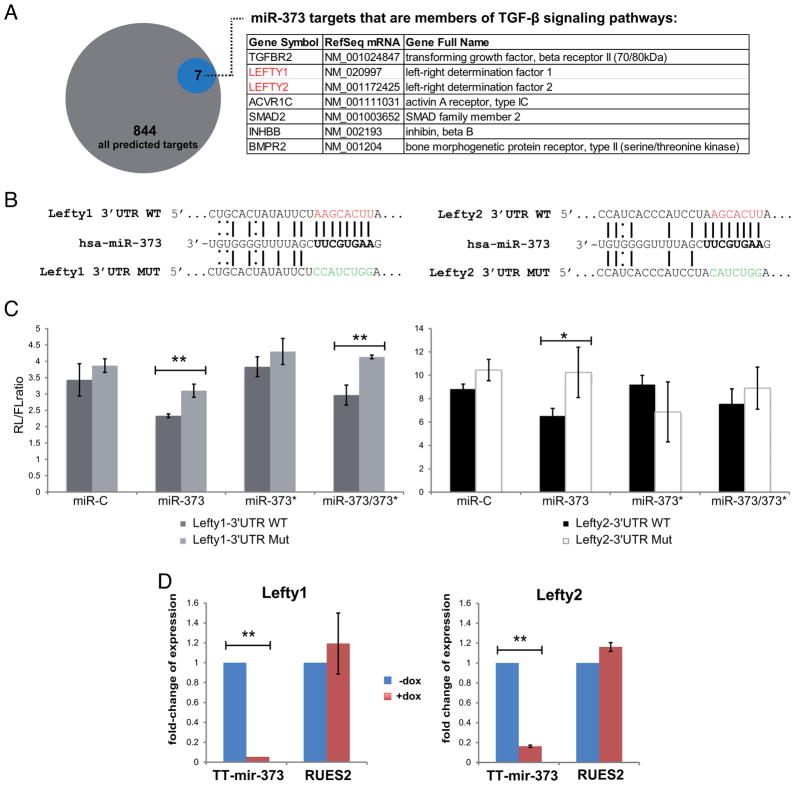
Figure 4. miR-373, but not miR-373*, targets Lefty1 and Lefty2.
(A) TargetScan predicts that miR-373 targets 844 3′UTR sequences. Members of the TGF-β signaling family are indicated in the table. (B) Schematic representation of the binding of miR-373 on either the wild-type (WT) or mutated (MUT) Lefty1 or Lefty2 3′UTRs; WT seeds are marked in red, MUT seeds in green, Watson-Crick base pairing with a straight line and U-G wobbles with a dotted line. (C) Luciferase assay in HeLa cells using Lefty1 and Lefty2 3′UTR Renilla(RL)-reporter constructs; Firefly (FL)-luciferase was used as a transfection control. Data points represent the RL/FL ratio and are average values from triplicates. Error bars represent standard deviations. *p<0.05, **p<0.01. (D) Real-Time qPCR analysis of Lefty1 and Lefty2 expression after 5 days of doxycycline treatment in TT-miR-373 and RUES2 cells. Data points are presented as fold-change of expression relative to uninduced (−Dox, blue bars) cells, ±s.dev.

