
Figure 7. Relationship between TBS effects across sites.
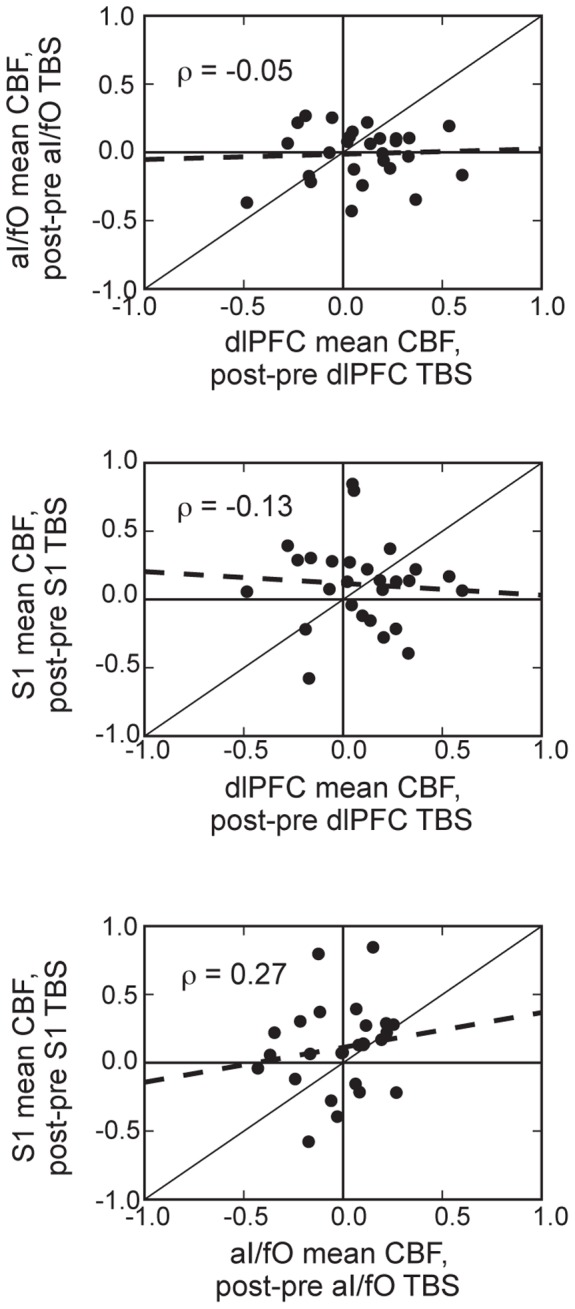
This figure shows the relationship between changes in rCBF under the coil for different TMS sites targeted on separate days, with each individual point representing a single participant. Changes in rCBF under the coil were not strongly correlated across different TBS locations (dlPFC to aI/fO, top: r = −0.06; S1 to dlPFC, middle: r = −0.14; S1 to aI/fO, bottom: r = 0.26). Dashed lines indicate the linear regression fit, and black diagonal lines indicate equality between the TBS effects on perfusion.