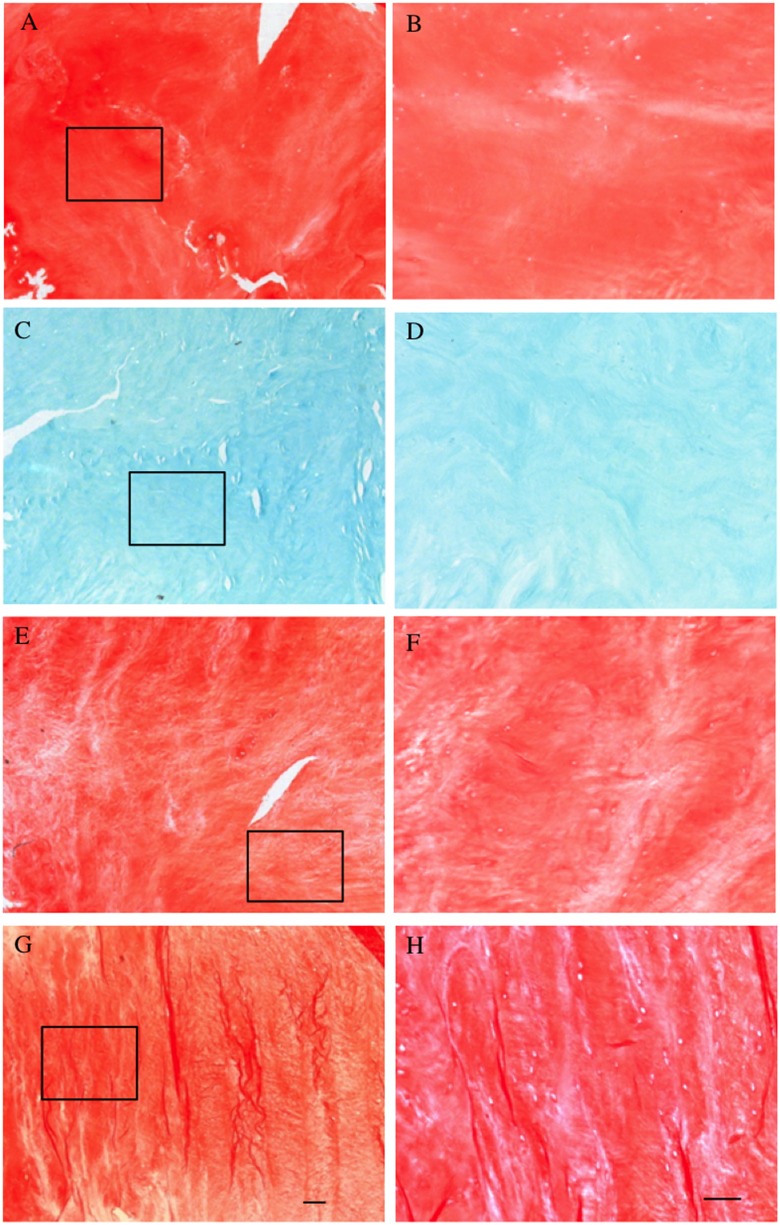
Figure 8. Proteoglycan distributions in loaded and unloaded discs.
Discs were cultured for 14 days unloaded (A–D) or loaded (E–H), without (A, B, E and F) or with trypsin-induced degeneration (C, D, G and H). The discs were evaluated by histology using Safranin O staining. A, C, E and G are show overviews of the NP region at low magnification. B, D, F and H represent a higher magnification of the boxed areas. Scale bars, 100 and 200 µm.

