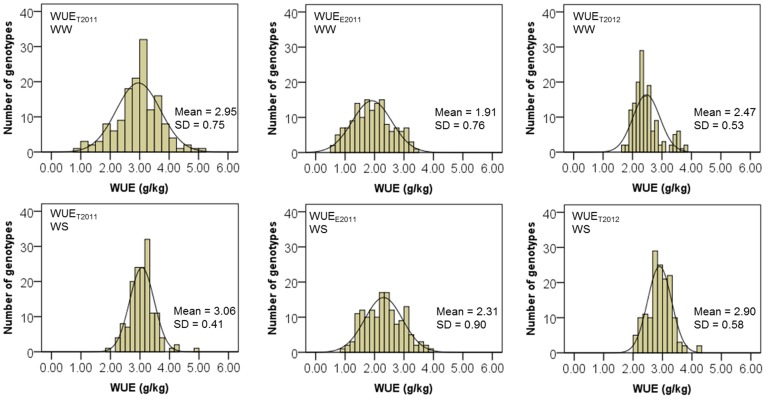
Figure 2. Frequency distribution for water use efficiency (WUE) in Exp. 2011 and 2012 of 150 recombinant inbred lines (RILs).
WUET2011: total water use efficiency “total” in Exp. 2011; WUEE2011: water use efficiency “estimation” in Exp. 2011; WUET2012: water use efficiency “total” in Exp. 2012. WW: well-watered; WS: water-stressed. For WUET2011 and WUEE2011 at WW, data represent 150 RILs (n = 150); for WUET2011 and WUEE2011 at WS, data represent mean of three replicates of 150 RILs (n = 150); for WUET2012 at WW and WS, data represent mean of two replicates of 150 RILs (n = 150). SD: standard deviation.

