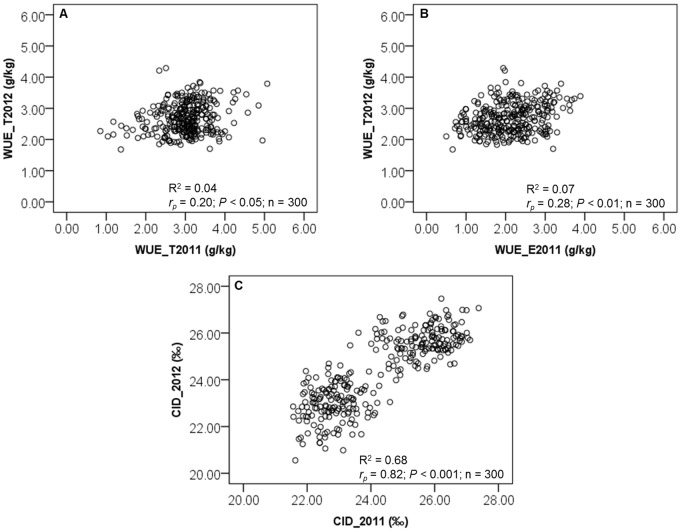
Figure 5. Relationship between (A, B) WUE and (B) CID values for 150 recombinant inbred lines (RILs) determined in two separate experiments (Exp. 2011 and 2012).
For each trait and experiment, mean of well-watered (WW) and water-stressed (WS) plants were grouped together (n = 300). Phenotypic correlation (rp) value is provided in each graph.

