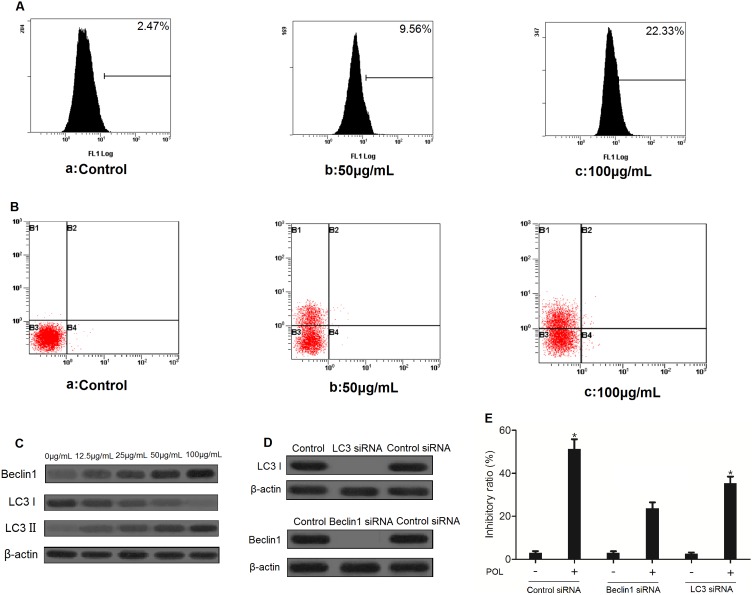
Figure 3. POL induces autophagy in A549 cells.
A549 cells (A) and HELF cells (B) were treated with PBS (24 h) or 23 µg/mL POL for indicated time, and the MDC fluorescent intensity was analyzed by flow cytometry. (C) A549 cells were treated with PBS (24 h) or 23 µg/mL POL for indicated time, and the acridine orange fluorescent intensity was measured by flow cytometry. (D) A549 cells were treated with 23 µg/mL POL for indicated time, followed by Western blot analysis for detection of phosphorylated-Beclin1 and LC3 levels. β-actin was used as an equal loading control. (E) A549 cells were transfected with Beclin1, LC3 or control siRNA for 24 h, the Beclin1 and LC3 levels were examined by Western blot analysis. (F) A549 cells were transfected with Beclin1, LC3 or control siRNA for 24 h followed by stimulation with or without 23 µg/ml POL for 24 h, the cell growth inhibition ratio was measured by the MTT assay (mean±SEM, n = 3).

