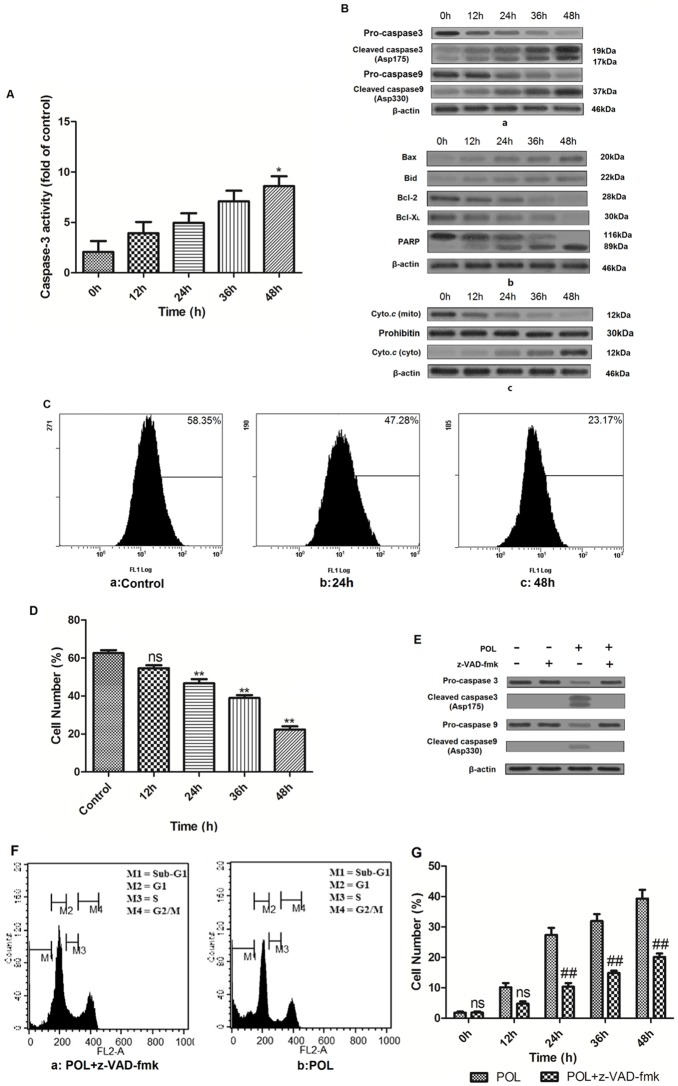
Figure 4. POL induces apoptosis through caspase-dependent manner.
(A) Effects of 23 µg/mL POL on caspase-3 activation with increasing time (mean±SEM, n = 3) (*p<0.05 vs. 0 h group). (B) 23 µg/mL POL induced cleavage of caspase-3, caspase-9 (a). POL resulted in cleavage of PARP, up-regulation of pro-apoptotic Bax and Bid, as well as down-regulation of anti-apoptotic Bcl-2 and Bcl-XL with culturing time (b). Cell lysates were fractionated to isolate cytoplasmic and crude mitochondria, and the presence of cytochrome c in cytosolic and mitochondrial fractions was assessed by WB analysis using the ApoTrack antibody cocktail. β-Actin was used as an cytosol equal loading control, while prohibitin was used as mitochondria loading control (c). (C) The influence of 23 µg/mL POL on the integrity of mitochondrial membranes was measured by rhodamine 123 staining, and fluorescence intensity was analyzed by flow cytometry. (D) The varieties of mitochondrial membranes potential were further presented as bar diagram (mean±SEM, n = 3) (**p<0.001 vs. Control group, ns: no significant vs. Control group). (E) Western blot analysis of pro-caspase 3, cleaved caspase 3, pro-caspase9 and cleaved caspase9 levels in A549 cells treated with 23 µg/mL alone or in combination with 10 µM caspase inhibitor z-VAD-fmk for 24 h. (F) A549 cells were treated with 23 µg/mL POL alone or combined with 10 µM caspase inhibitor z-VAD-fmk for 24 h and stained with propidium iodide (PI), quantitation of the PI staining data presented as the percentages of cells in SubG1 phase. (G) The influence of caspase on 23 µg/mL POL-induced SubG1 phase ratio was represented as bar diagram (mean±SEM, n = 3) (##p<0.001 vs. POL group, ns: no significant vs. POL group).

