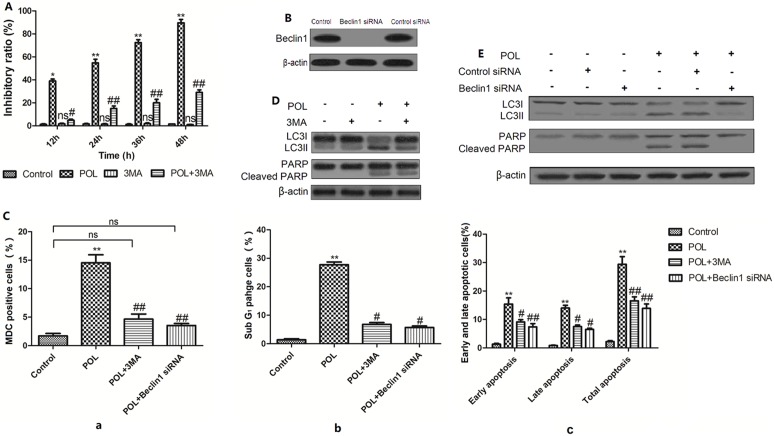
Figure 5. Inhibition of autophagy results in reduction of apoptosis by POL.
(A) A549 cells were pretreated with 2 mM 3MA 1 h prior to the administration of 23 µg/ml POL for indicated time, and the cell inhibitory ratio was measured by MTT assay. Control group was treated with PBS. (mean±SEM, n = 3) (*p<0.05, **p<0.001 vs. Control group, ns: no significant vs. Control group, #p<0.05, ##p<0.001 vs. POL group). (B) A549 cells were transfected with control siRNA and specific Beclin1 siRNA for 24 h, the Beclin1 level was examined by Western blot analysis. (C) A549 cells were pretreated with 2 mM 3MA or transfected with specific Beclin1 siRNA prior to the administration of 23 µg/ml POL for 24 h, and the MDC fluorescent intensity (a), SubG1 phage cell ratio (b) and early as well as late apoptosis (c) were analyzed by flow cytometry. Control group was treated with PBS for 24 h. Data were represented as bar diagram. (mean±SEM, n = 3) (*p<0.05, **p<0.001 vs. Control group, ns: no significant vs. Control group, #p<0.05, ##p<0.001 vs. POL group). (D) Cleaved PARP and LC3-II expressions in A549 cells treated with 23 µg/ml POL for 24 h in the absence or presence of 3MA (2 mM) were measured. The representative figures were shown. (E) A549 cells were preferentially transfected with control siRNA or specific Beclin1 siRNA for 24 h before 23 µg/ml POL treatment for another 24 h, and cleavage of PARP as well as expression of LC3II were measured.

