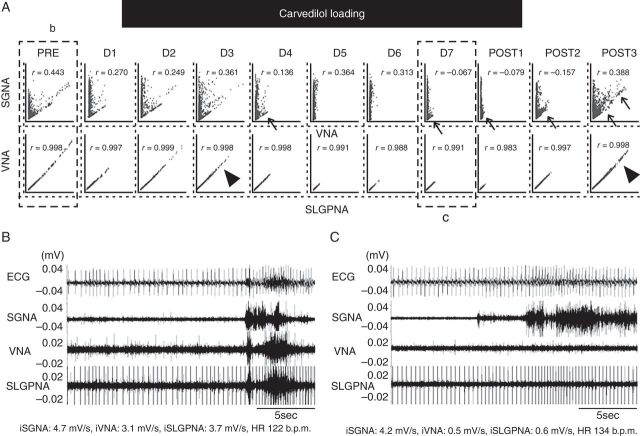
Figure 3.
Carvedilol selectively suppressed VNA and SLGPNA. (A) L-shaped correlation between SGNA and VNA at baseline (b). Carvedilol loading eliminated the lower arm of the L-shape on Days 5 (D5) and 6 (D6), resulting in isolated SGNA without VNA on those two days. The VNA–SLGPNA correlation remains linear during D5 and D6, but the high output portion of the graph (arrowhead, D3) was eliminated. That portion of the graph recovered 3 days after carvedilol withdrawal (POST3). (B, C) Representative examples of ANA. (B) Simultaneous discharges of SGNA, VNA, and SLGPNA. (C) Carvedilol selectively suppressed VNA and SLGPNA, but not SGNA.

