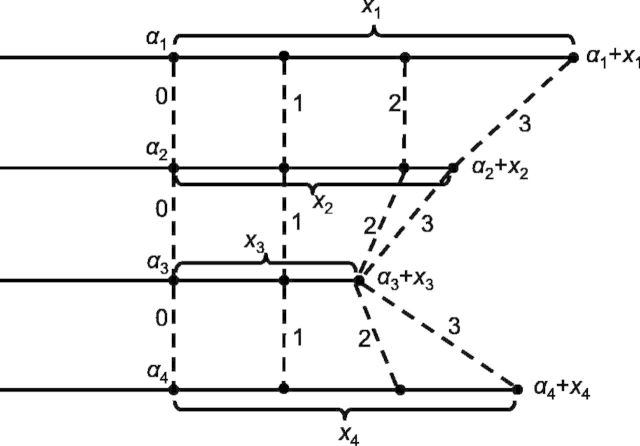
Fig. 3.
A graphical depiction of the mesh algorithm for evaluation of the log-likelihood in (29). The count in the ith category is represented by a line segment and can be partitioned into a sum of L = 3 sub-counts represented by sub-segments. At points connected by the dashed lines ( ), the DMN log-likelihood can be evaluated using (20), and there are three such evaluations in this example

