
Figure 4.
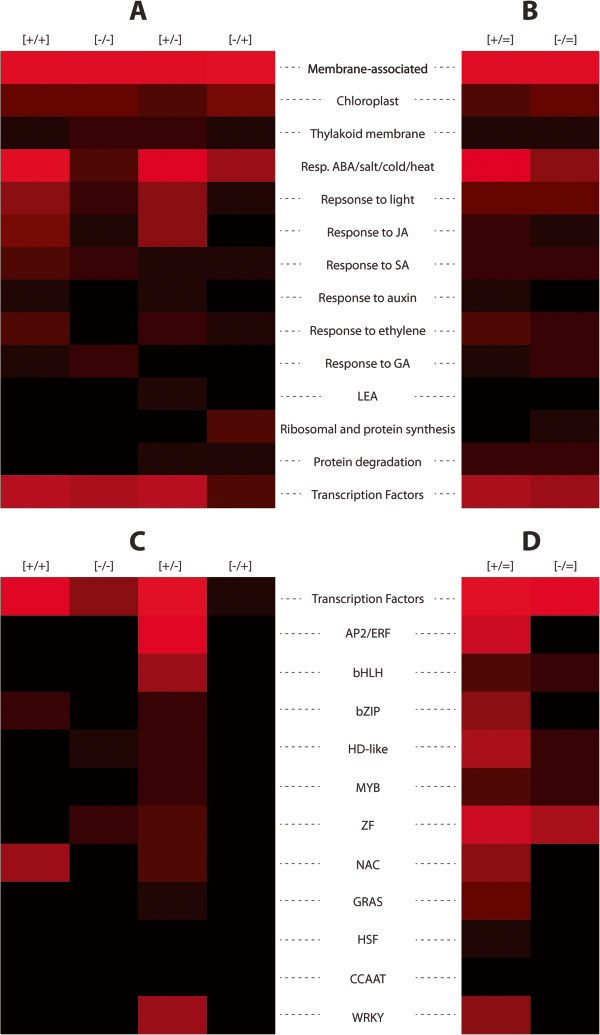
Heat map illustrating the distribution of maize dehydration stress memory and non-memory classes according to different functional, biological process, and cellular component groups. Heat maps follow the percentage-wise distributions of genes (Table 2, and Additional file 6) over various groups according to GO categories from the four memory classes (A) or the non-memory class (B). Distribution of TFs encoded by memory genes (C) and non-memory genes (D)in Z. mays. Pitch-black indicates 0%, and red is a linear increase in brightness to a maximum of 60% recalculated to follow the total number of transcription factor genes in the memory or non-memory categories. The heatmap function in MATLAB® was used to generate Figure 4.