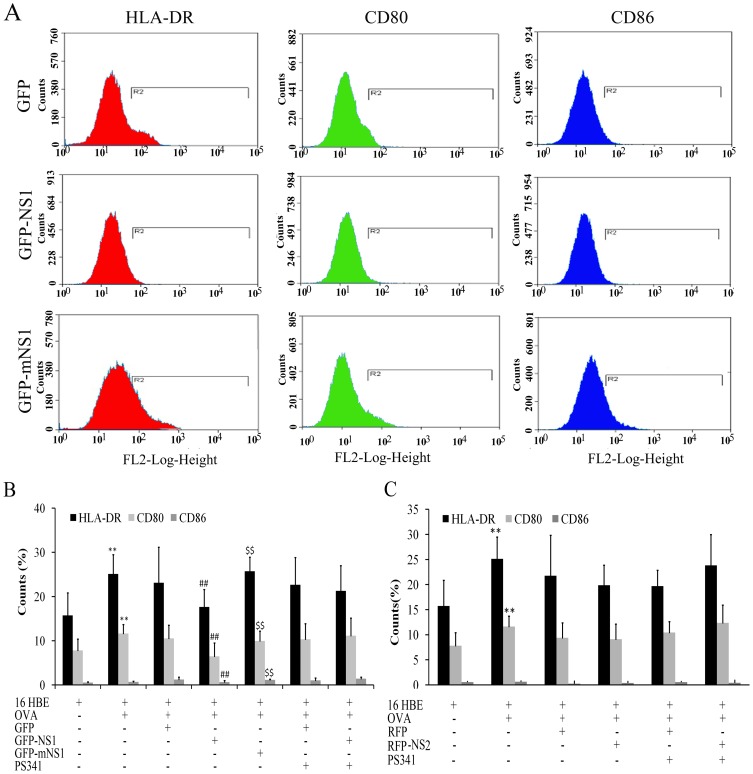
Figure 3. The expression of HLA-DR, CD80 and CD86 on 16 HBE was assayed by flow cytometry.
A, B: The influence of NS1 on the expression of HLA-DR, CD80 and CD86 on 16 HBE with or without OVA treatment (**P<0.01 versus 16 HBE group; ##P<0.01 versus GFP group; $$P<0.01 versus GFP-NS1 group). C: The influence of NS2 on the expression of HLA-DR, CD80 and CD86 on 16 HBE with or without OVA (**P<0.01 versus 16 HBE group). Data represent Means ± SE of 6 experiments.

