
Figure 2.
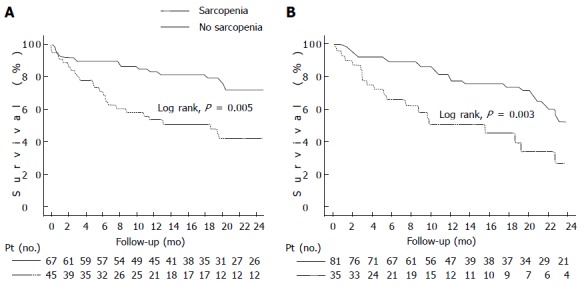
Kaplan-Meier curve indicating the survival of patients with cirrhosis (A) and patients with cirrhosis and hepatocellular carcinoma (B). A: Kaplan-Meier curve indicating the survival of cirrhotic patients with and without sarcopenia. The 6-m probability of survival was 71% and 90%, respectively (P = 0.005, Log-Rank test); B: Kaplan-Meier curve indicating the survival of patients with cirrhosis and hepatocellular carcinoma with and without sarcopenia. The 6-mo probability of survival was 67% and 90%, respectively (P = 0.003, Log-Rank test).