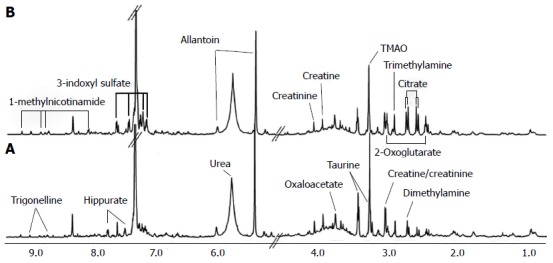
Figure 3.

Nuclear magnetic resonance spectra of urine samples from control (A) and cancerous mice (B)[96]. A number of metabolites showed significant metabolic changes in their levels. For example, trimethylamine oxide (TMAO) levels are reduced in cancerous mice compared with control.
