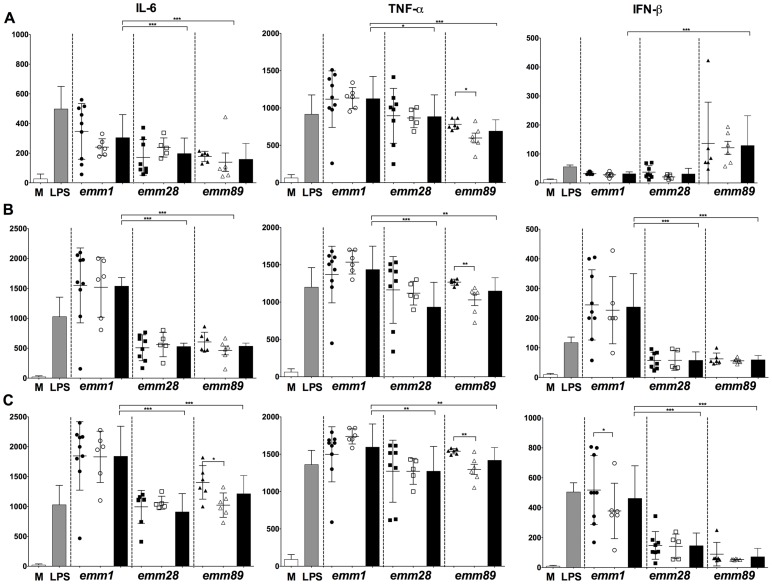
Figure 2. GAS clinical isolates induced pro-inflammatory mediator and IFN-β secretion by infected BMDMs.
Graphics represent IL-6, TNF-α and IFN-β quantification in the cell culture supernatant at T2h (A), T4h (B) and T6h (C) after infection by the different emm type isolates. The mean values immune mediator productions induced by all (black bars), invasive (black symbols) and non-invasive (white symbols) of isolates of each emm type are shown. To note, the scales are different, within the IL-6 data in panel A and, within the IFN-β data in panel C. The results represent the mean ± SD of 3 independent experiments; with significance levels indicated between emm1 and other emm types by stars above the corresponding black bar and within emm types by stars above a line overlapping the corresponding the black and white symbols (*p≤0.05; **p≤0.01; ***p≤0.005).

