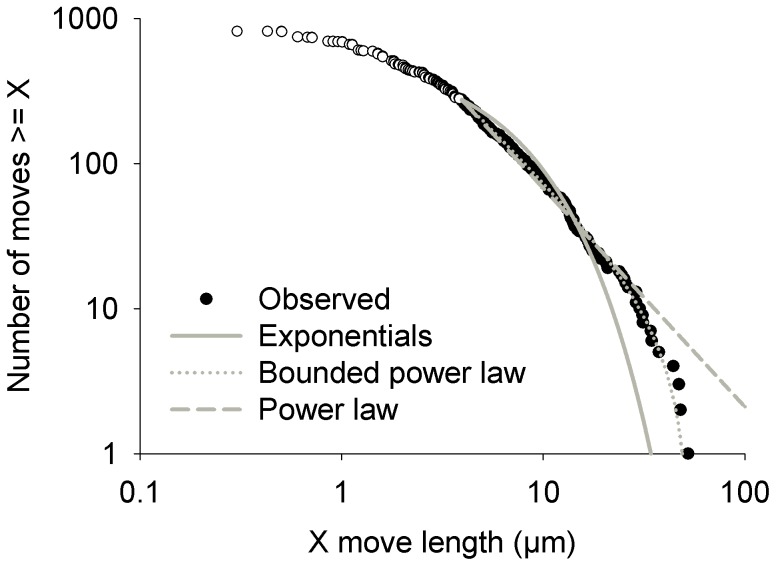
Figure 9. Rank frequency plot of move lengths of Tabularia fasciculata male gametes.
Videos with presence and absence of a female gamete have been combined for this plot. The open circles represent moves not included in the tail of the distribution, whereas filled circles are part of the tail. The different lines represent the fit of the distributions tested. Note that the exponential and bounded exponential distributions overlap perfectly within the range of values observed.

