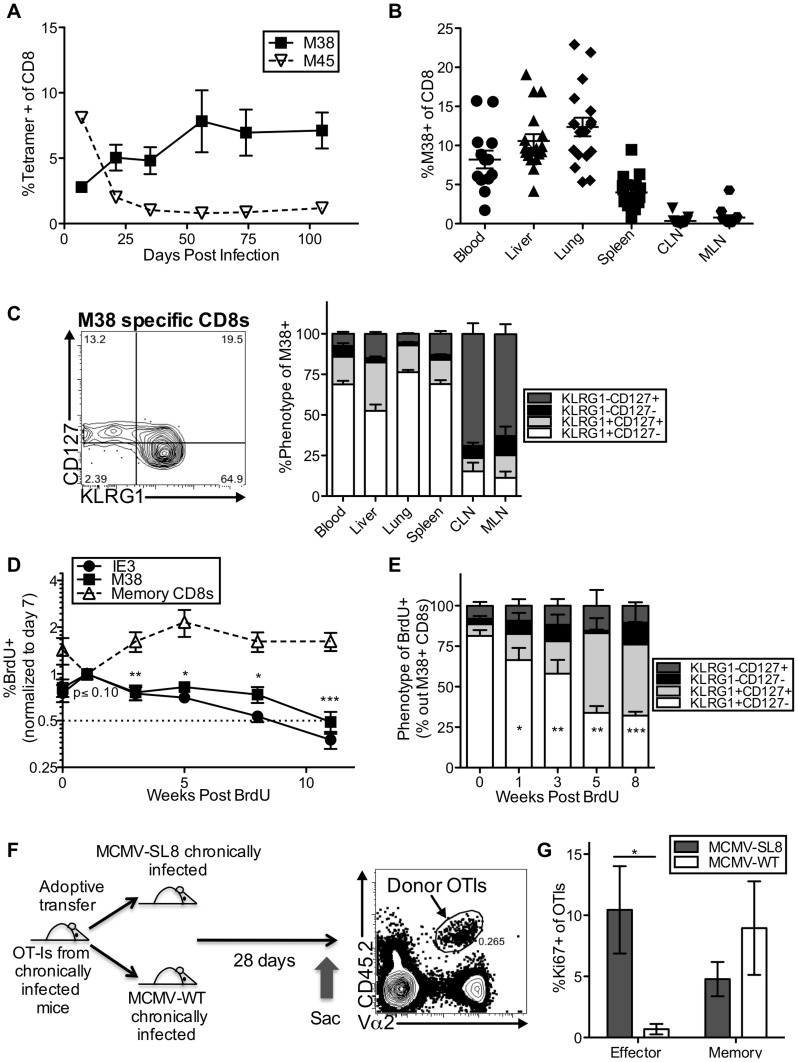
Figure 1. Effector-phenotype CD8s turnover continuously and undergo antigen-dependent division during MCMV-induced memory inflation.
(A) In C57BL/6 mice infected with K181 MCMV, M38-specific T cells accumulate over time while M45-specific T cells contract. Shown is the frequency of MCMV-specific CD8s in the blood over time, as measured by tetramer staining. (B) Inflationary T cells are also found in non-lymphoid organs. Shown is the frequency of M38-specific CD8s in the indicated organs of mice infected as in A, more than 3 months post infection. Each symbol represents an individual mouse. (C) Most inflationary T cells express an effector phenotype. Mice were infected as in A. The representative FACS plot (left) shows the KLRG1 and CD127 expression of M38-specific CD8s in the blood. The graph (right) shows the KLRG1 and CD127 expression of M38-specific T cells in organs more than 3 months post infection (n = 12, CLN = cervical lymph nodes, MLN = mediastinal lymph nodes). (D) Recently divided inflationary T cells are lost over time. B6 mice infected with K181 MCMV or WT-BAC MCMV for more than 3 months were pulsed with BrdU for 3 (n = 6) or 7 (n = 5) days. To account for mouse-to-mouse variation in the incorporation of BrdU, the data was normalized to the frequency of inflationary T cells that were BrdU-positive 7 days post-pulse. Shown is the proportion of M38- and IE3-specific CD8s that retained BrdU in the blood over time. Statistical significance was determined by comparing the proportion of cells retaining BrdU relative to the week 1 time point, using a paired student's t-test (*p<.05, **p<.01, ***p<.001). As a comparison, the same analysis was performed on total CD8 T cells (not antigen-specific) expressing CD127 and lacking KLRG1. Combined data from two independent experiments is displayed. (E) Recently divided inflationary T cells with an effector phenotype are lost over time. Shown is the phenotype of BrdU-positive M38-specific T cells at the indicated time points after BrdU pulse. Any data points with fewer than 25 labeled M38-specific T cells were excluded from the analysis at that time point. Statistical significance was determined as in “D” except that the proportion of BrdU-labeled cells expressing an effector phenotype was compared to the week 0 time point. (F) Adoptive transfer schematic. The representative FACS plot shows donor OT-Is, as a frequency of all CD8s, in the spleen of recipients 28 days after transfer. (G) Donor OT-Is with an effector phenotype only express Ki67 in the presence of cognate antigen. Shown is the Ki67 expression of effector-phenotype (KLRG1pos, CD127low) and memory-phenotype (KLRG-1neg, CD127pos) OT-Is in the spleen 28 days post transfer. Results are a combination of two independent experiments (n = 6 per group). Statistical significance was measured by an unpaired student's t-test (*p<.05). In all cases above, error bars represent the standard error of the mean.

