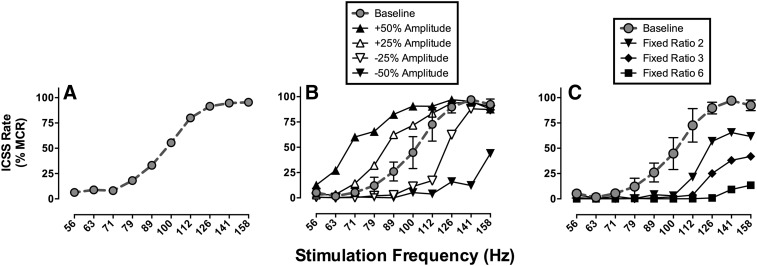
Fig. 3.
ICSS frequency-rate curves obtained with MFB electrodes in Sprague-Dawley rats. Abscissae: frequency of brain stimulation in Hz (log scale). Ordinates: ICSS rate expressed as percent maximum control rate (%MCR; see text for details). (A) A baseline frequency-rate curve determined under a fixed-ratio 1 (FR 1) schedule of reinforcement for stimulation amplitude determined individually in each rat. This curve shows mean data from 34 rats used in one study (Negus et al., 2012a). (B) Effects of manipulating stimulation amplitude in a group of 3 rats. Increases/decreases in amplitude produced leftward/rightward shifts in the frequency-rate curve, respectively. (C) Effect of manipulating the FR ratio requirement in the same group of 3 rats. Increasing the ratio requirement produced downward shifts in the frequency-rate curve. Data in (B) and (C) are unpublished but were collected as in studies of drug effects in this frequency-rate procedure.

