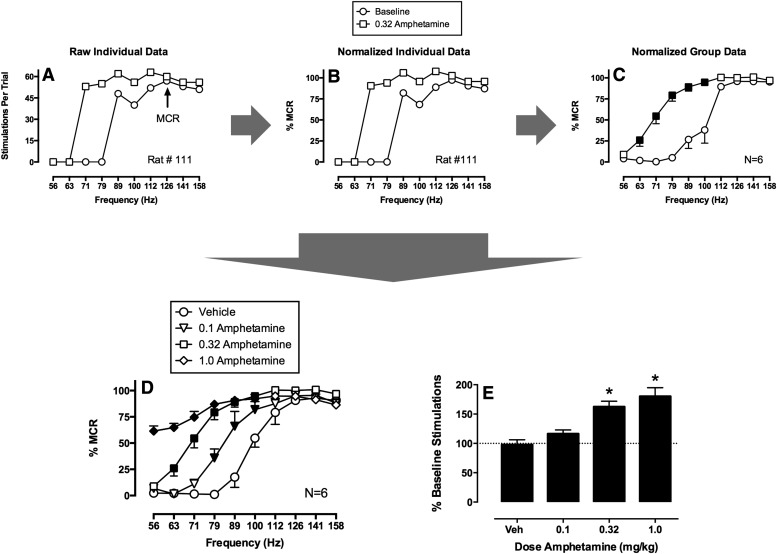
Fig. 5.
Strategy for analysis of data from a frequency-rate procedure for abuse potential testing. Raw baseline and test data (A) for each rat are normalized (B) to that rat’s maximum control rate (MCR) on that day. (C) Normalized data can then be averaged across rats to yield mean baseline and test frequency-rate curves (N = 6). Filled points show test ICSS rates significantly different from baseline as indicated by a significant two-way ANOVA followed by a Holm-Sidak post hoc test (P < 0.05). (D) Alternatively, test data from different test sessions can be compared, and filled points show a data significantly different from vehicle as determined by significant two-way ANOVA followed by a Holm-Sidak post hoc test (P < 0.05). (E) A summary measure of drug effects on ICSS in which the test number of stimulations summed across all frequencies is expressed as a percentage of the baseline number of stimulations across all frequencies. The asterisks indicate significant differences from vehicle as determined by one-way ANOVA followed by Dunnett's post hoc test (P < 0.05). This measure integrates both rate-increasing and rate-decreasing drug effects and has proven useful in correlations with drug self-administration data. Data set has been published (Bauer et al., 2013b).

