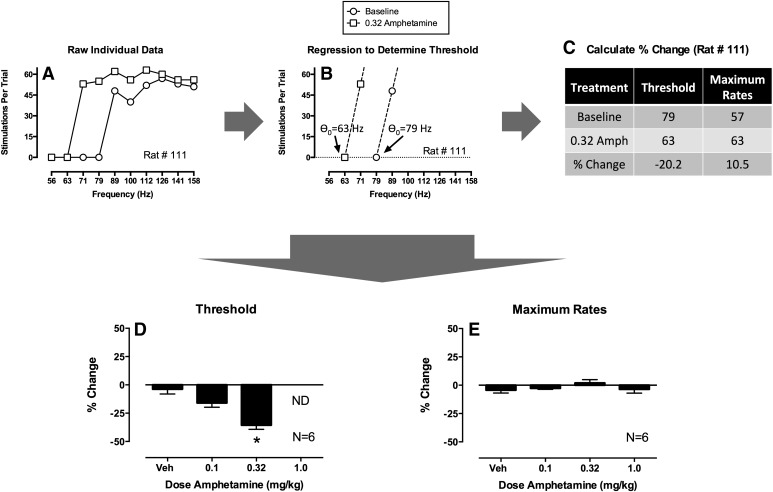
Fig. 6.
“Curve-shift” strategy for analysis of data from a frequency-rate procedure using the same data set as in Fig. 5. (A) Analysis begins with raw baseline and ICSS data as in Fig. 5. (B) Regression analysis is used to identify metrics of the lateral position of the frequency-rate curve along the X-axis. In this case, linear regression through the ascending portions of the frequency-rate curves were used to determine θ0, the “threshold” frequency at which the regression line crosses the X-axis. (C) Drug-induced changes in threshold and maximum rates can then be determined in each rat, and effects are usually expressed as percent change. (D and E) Values can then be averaged across rats and submitted to statistical analysis. The asterisk in (D) indicates significant differences from vehicle as determined by one-way ANOVA followed by Dunnett’s post hoc test (P < 0.05). Notice that threshold values were not determined (ND) for 1.0 mg/kg amphetamine. See text for details.

