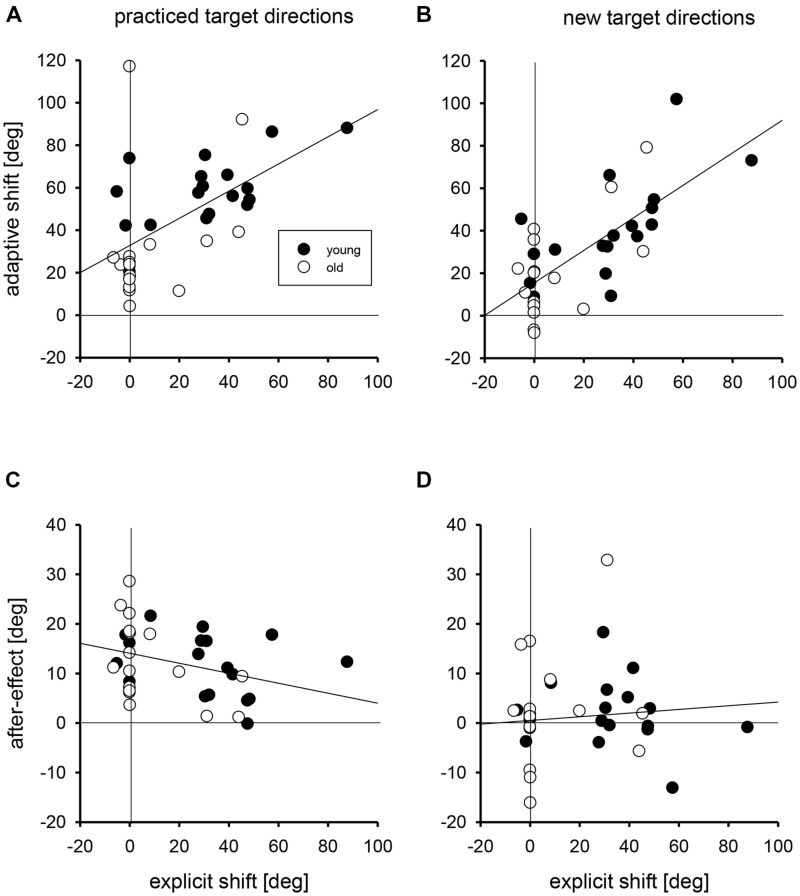
FIGURE 3.
The regressions of individual adaptive shifts for practiced (A) and new target directions (B) and of individual after-effects for practiced (C) and new target directions (D) on individual explicit shifts. Filled circles mark the individual data points of young participants, open circles those of older participants. The zero points on the abscissae and ordinates are marked by vertical and horizontal lines, respectively.

