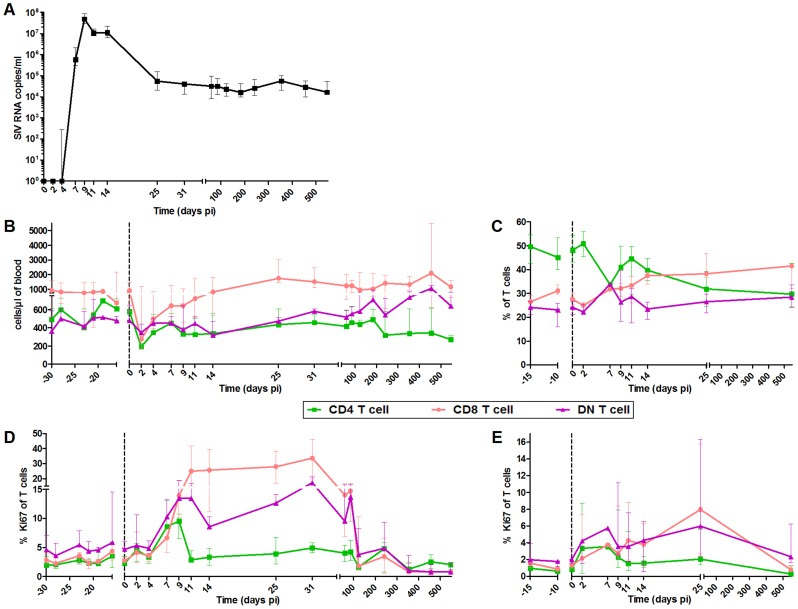
Figure 1. Follow-up of virological and immunological markers during primary SIVagm infection.
(A) Plasma viral RNA copy numbers were measured by real-time PCR in 6 AGMs infected with SIVagm.sab92018. Flow cytometry evaluation of (B) CD4+, CD8+ and DN T cell counts in blood, (C) CD4+, CD8+ and DN T cell percentages in LNs; CD4+, CD8+ and DN T cell proliferation as evaluated by Ki-67+ cells percentages in (D) blood and (E) LNs. Data are presented as medians and interquartile ranges. Day zero represents the median of all the time points before infection. When p-values between time points were determined (cf. results), the Wilcoxon matched-pairs signed rank test was used.

