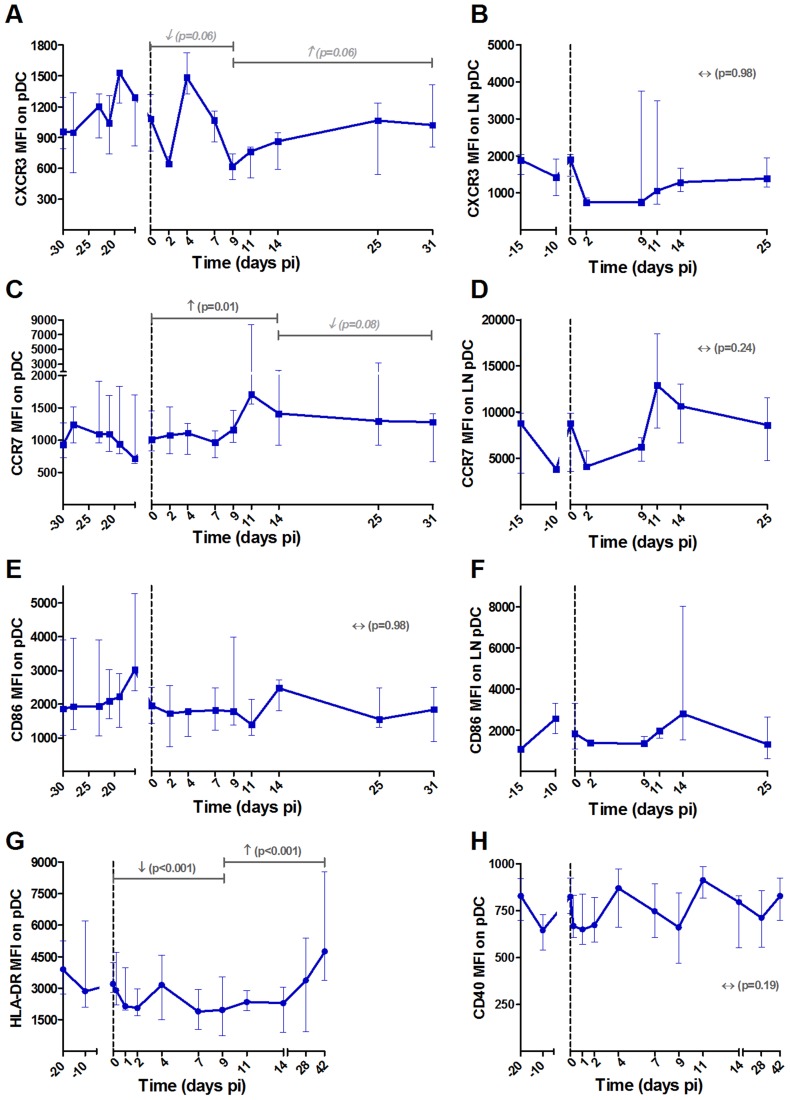
Figure 3. Follow-up of homing and maturation markers on pDCs in blood and lymph nodes following SIVagm infection.
PDCs were defined as shown in Figure S1. Expression levels of the chemokine receptors (A, B) CXCR3 and (C, D) CCR7 and the (E, F) co-stimulatory CD86 on (A, C, E) blood and (B, D, F) LN pDCs are shown as MFI after substraction of isotype-control values (n = 6 AGMs). The expression levels of (G) HLA-DR and (H) CD40 were analyzed on another group of 8 AGMs. PDCs were here defined as CD20− BDCA2+ CD123+ HLA-DR+. Data are presented as medians and interquartile ranges. Day zero represents the median of all the time points before infection. See legend to Figure 2 for a description of p-values (logarithm transformation for panel B).

