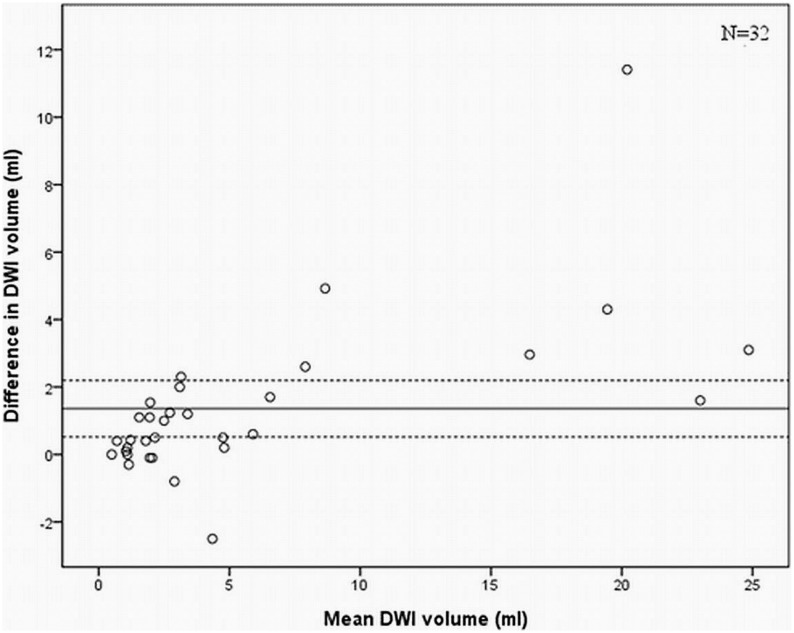
Figure 2. Bland Altman plot on DWI volume between observers demonstrating good overall agreement, but a slight tendency towards larger differences in DWI in larger lesions with vertical spread of scatter points being narrower at low values of mean than at high values of mean.
This variation indicates that the method of manual segmentation of postoperative DWI changes depends somewhat on the volume of DWI changes. The line represents mean difference and the dotted lines the 95% CI.

