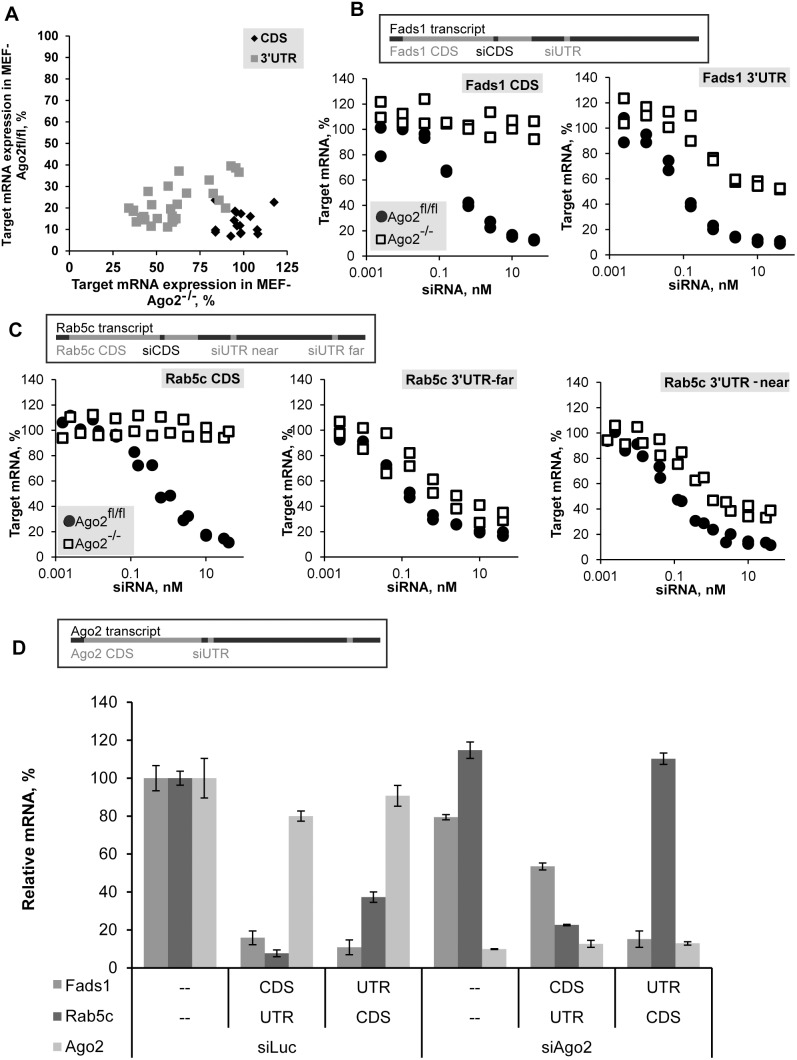
Figure 1. Differential Ago2 dependence of siRNAs targeting coding sequence (CDS) and 3′-untranslated region (3′UTR) of mRNA in vitro.
(A) Mouse embryonic fibroblast (MEF) cells, Ago2fl/fl and Ago2−/− (wild-type and Ago2 knockout) were transfected with 10 nM of siRNAs targeting CDS or 3′UTR (16 or 28 siRNAs, respectively, Table S1) of mRNAs of four genes: Fads1, Fads2, Rab5a, and Rab5c. Levels of expression of target-gene mRNA in Ago2fl/fl MEF cells and Ago2−/− MEF cells measured by branched DNA (bDNA) assay 24 h post-transfection were plotted as percentage of relative target mRNA compared to Luciferase siRNA transfected controls. (B, C) Ago2−/− MEF cells (square) or Ago2fl/fl MEF cells (circle) were transfected with siRNAs targeting CDS or 3′UTR of Fads1 (B) or Rab5c (C) mRNA (relative positions of target sites within mRNA are shown). Transfection and assay as described in A, but dilution series with the maximum dose of 40 nM were done. Combined results of two independent transfections are shown. (D) Ago2fl/fl MEF cells were transfected with 10 nM siRNA targeting 3′UTR of Ago2 (Eif2c2) mRNA or Luciferase, followed by transfection with two combinations of siRNAs targeting Fads1 and Rab5c (CDS-targeting for one gene and 3′UTR-targeting for the other gene, 10 nM each, or 20 nM of Luciferase siRNA control) 48 hours later. Levels of target-genes and Ago2 mRNA expression measured by bDNA assay 24 h after second transfection were plotted as percentage of relative target mRNA compared to Luciferase siRNA-transfected control (mean ± s.d., n = 3). Legend in the bottom left corner of the graph also indicates the line in the X-axis describing the treatment type (none, CDS, 3′UTR) by target gene.

