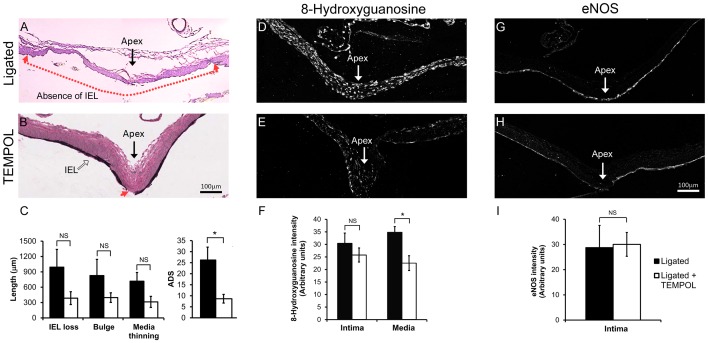
Figure 6. TEMPOL inhibition of flow-induced aneurysm initiation at the BT.
A) Van Gieson’s stain of the BT 5 days after bilateral CCA ligation shows extensive IEL loss, slight bulge formation, and medial thinning (between red arrows). B) BT in TEMPOL-treated animals 5 days after ligation showed only slight IEL loss (red arrow) and minimal bulge formation and medial thinning. (C) The composite ADS was significantly lower 5 days after ligation in TEMPOL-treated versus untreated ligated animals. The lengths of IEL loss, bulging, and media thinning were all reduced, but these differences did not reach statistical significance. (D) Immunofluorescent staining of 8-hydroxyguanosine at the BT of CCA ligated animals compared to (E) ligated animals treated with TEMPOL. (F) Average intensity of 8-hydroxyguanosine was significantly lower in the media of TEMPOL-treated animals. (G) Immunofluorescent staining of eNOS at the BT of CCA ligated animals compared to (H) eNOS in ligated animals treated with TEMPOL. (I) There was no difference in eNOS intimal staining between animals with versus without TEMPOL. Scale bar = 100 µm. Bars in graphs represent mean ± standard error. * indicates statistically significant difference between groups (p≤0.05, Mann-Whitney U-test); NS indicates no significant difference.

