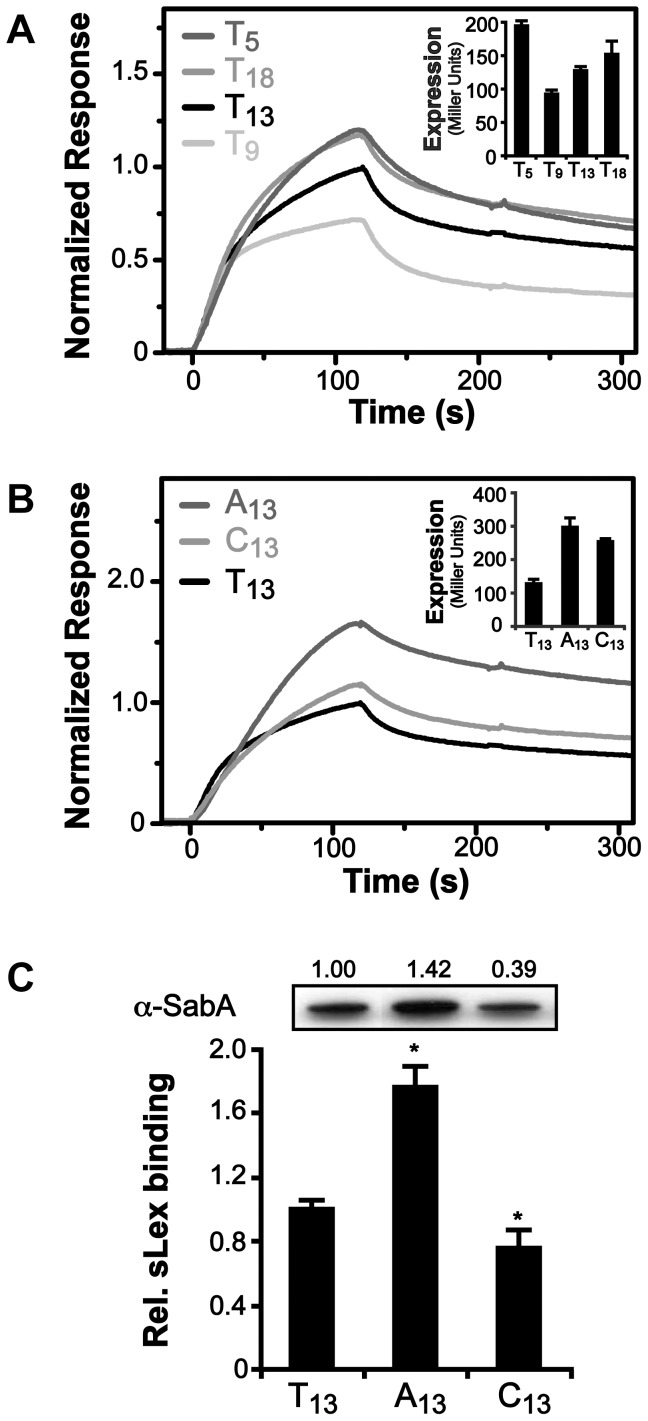
Figure 4. Binding of RNAP to PsabA DNA with varying tract length and nucleotide composition.
A) Analysis of E. coli σ70-RNAP binding to PsabA DNA by Surface Plasmon Resonance (SPR). Sensorgrams show injection of the σ70-RNAP (20 nM) over chips with pre-bound biotinylated-PsabA (−166 to +74) DNA fragments, with different T-tract lengths (T5, T9, T13 or T18). Inlay shows promoter activity of the corresponding T-tract variants, assayed in E. coli using transcriptional PsabA::lacZ fusions as described in Fig. S1. B) SPR sensorgrams analyzed as described in 4A but with PsabA DNA fragments containing A13- or C13-tracts. Inlay shows promoter activity of the corresponding variants, assayed in E. coli using transcriptional PsabA::lacZ fusions, as in Fig. S1. C) Analysis of SabA expression and sLex-receptor binding activity of variants of SMI109 harboring A13- or C13-tracts in PsabA. The image shows one representative immunoblot with α-SabA antibodies, where numbers above represent relative expression with expression in the T13-variant set to 1. Bar diagram show binding to soluble 125I-sLex-receptor conjugate of the same set of variants as in the immunoblot. Samples were prepared as described in Fig. 1A. Statistical tests showed significant differences to the T13 (wt) variant (* = p<0.05).

