
Figure 2. Effect of 2.0 nm Au deposition on MoS2 photoluminescence (PL).
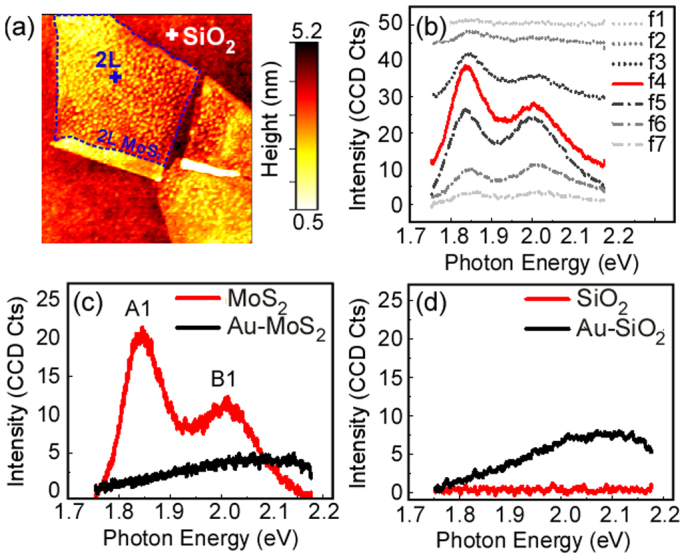
(a) AFM image of MoS2 flake as exfoliated. Cross marks indicate the location of the PL data presented in (b). (b) PL signal as a function of focal plane from above the surface (f1) to several tens of nm below the surface (f7). For clarity the curves were shifted of 4 units for each step. (c) PL spectra of 2 L MoS2 flake as exfoliated (red) and after 2.0 nm Au deposition (black). (d) Plasmonic response of the bare SiO2 substrate (red) and SiO2 substrate covered with the Au nanoislands (black).