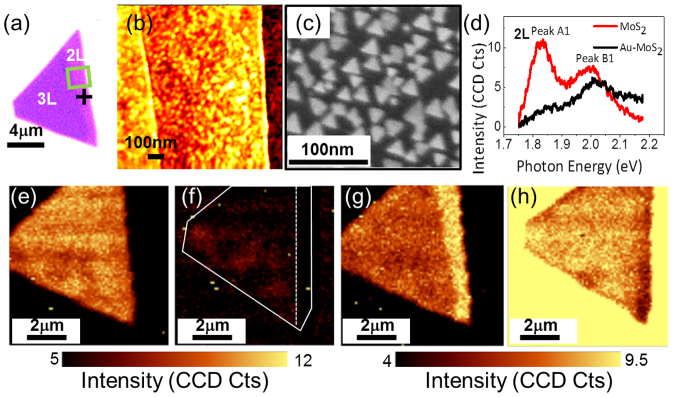
Figure 5. Effect of 1.0 nm Au evaporation on the photoluminescence properties of exfoliated MoS2.

(a) Optical image of exfoliated MoS2 flake. Different color contrasts show the different number of layers, corresponding to 2 layers (2 L) and 3 layers (3 L) as indicated on the image. (b) AFM image of MoS2 flake after 1.0 nm Au deposition. (c) SEM image of MoS2 flake after 1.0 nm Au deposition. (d) PL curve of the pristine MoS2 flake (red) and Au-MoS2 hybrid after 1.0 nm Au deposition (black) acquired at crossed labeled 2 L in (a), showing PL quenching of peak A1 and B1. PL intensity maps of peak A1 (e, f) and B1 (g,h) before (e,g) and after (f,h) 1.0 nm Au deposition. Contours were used in (f) to facilitate the comparison.
