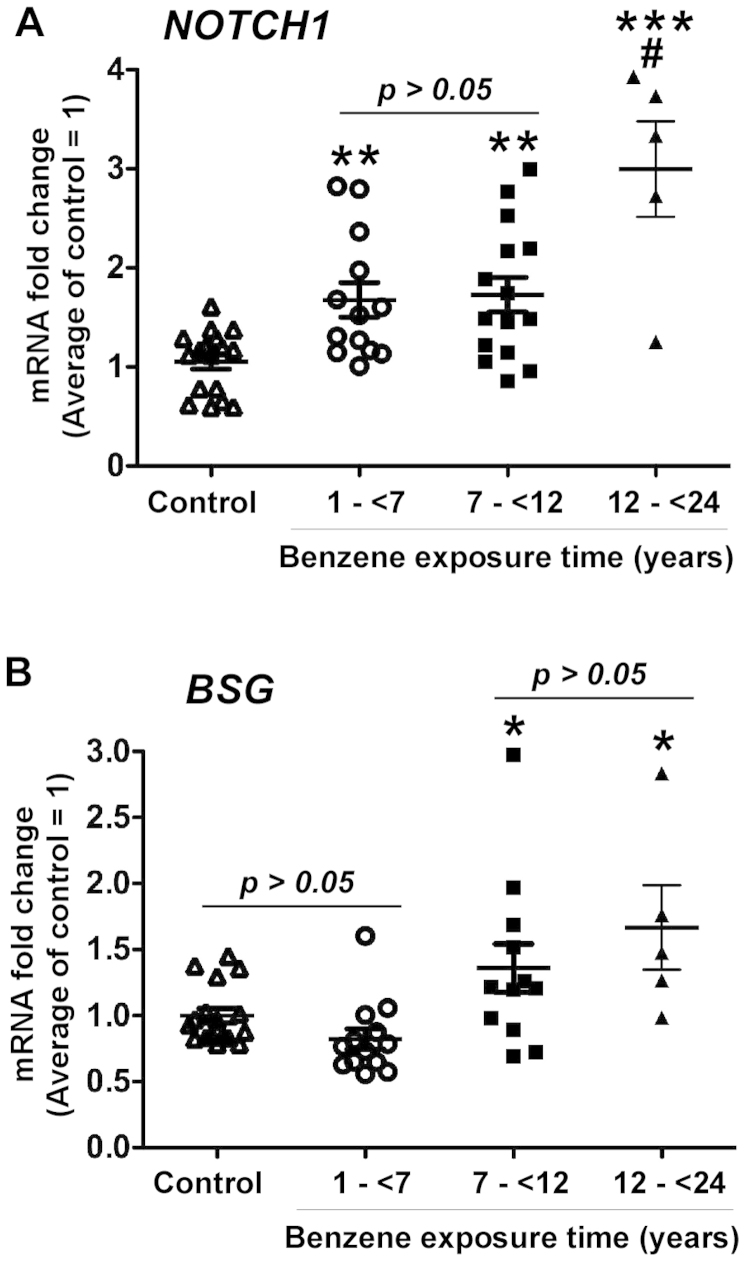
Figure 1. Up-regulation of NOTCH1 and BSG gene expression in benzene-exposed workers.
Blood cell samples were collected from benzene-exposed workers and controls for DNA isolation and Real-time PCR analysis to detect the mRNA levels of NOTCH1 (A) and BSG (B). The average of mRNA expression level in the control group was set as 1, and the mRNA expression level in each control subject and worker was compared to the average. * p < 0.05, ** p < 0.01, and *** p < 0.001 compared to the control group. # p < 0.01 compared to the 1 - < 7 years and 7 - < 12 years groups.

