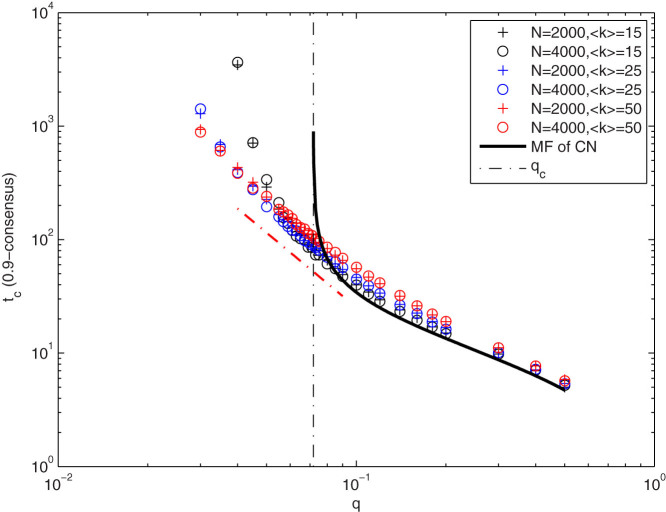
Figure 8. Time tc for 0.9-consensus for NG on RGG with different fractions (q) of committed agents with direct simulation on networks with average degrees 〈k〉 = 15, 25, 50, and network sizes N = 2000, 4000.
The solid black curve shows the mean field prediction of NG on the complete network(CN) as the limit case when 〈k〉 → ∞. The slope of the red data points near qc is −2.19.

