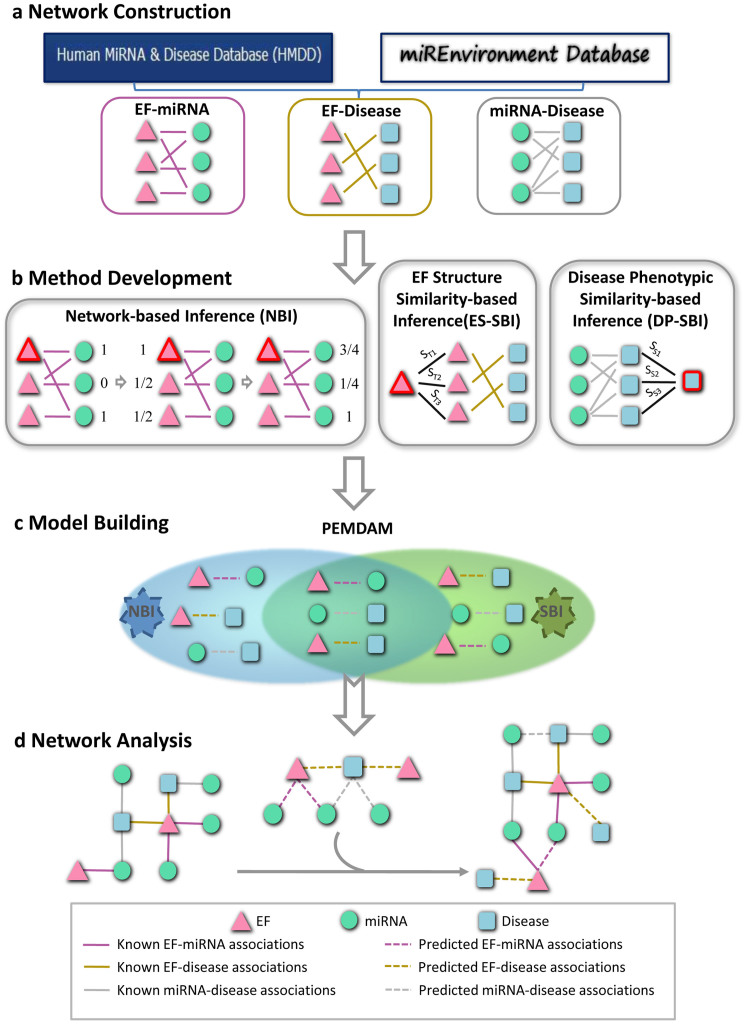
Figure 1. Diagram of the computational systems toxicology framework.
(a) The original data were collected from the Human MiRNA Disease Database and miREnvironment Database, and used to construct three bipartite networks: the EF-miRNA association (EMA), EF-disease association (EDA), and miRNA-disease association (MDA) networks. (b) Three methods, network-based inference (NBI), EF structure similarity-based inference (ES-SBI) and disease phenotypic similarity-based inference (DP-SBI), were developed to build the predictive model designated the predictive EF-miRNA-disease association model (PEMDAM). (c) The PEMDAM was built using the intersection of both of the prioritized lists from NBI and SBI. (d) Network visualization and analysis. EF: the environmental factor; ST: the Tanimoto similarity between two EFs; SS: the phenotypic similarity between two diseases.

