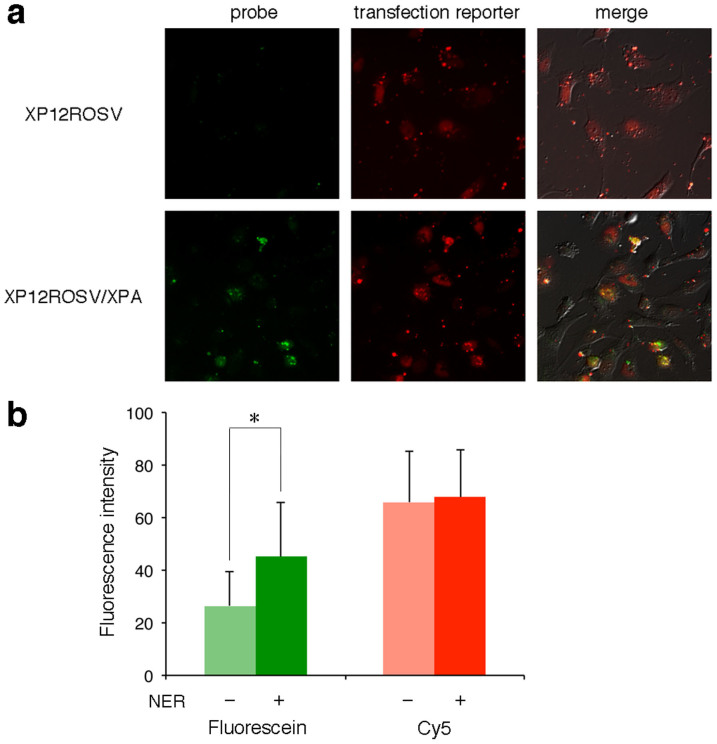
Figure 4. Detection of the cellular NER ability.
(a) The XPA cells (upper panels) and the same cells in which the XPA gene was expressed (lower panels) were cultured at 37°C for 6 h after transfection with pBSII KS (-) FQ64. (b) The fluorescein and Cy5 emissions from the pBSII KS (-) FQ64 probe and the transfection reporter, respectively, in the XP12ROSV (NER –) and XP12ROSV/XPA (NER +) cells, shown in panel a, were quantified. The data were statistically analyzed by Student's t test (n = 10; *, p < 0.01), and error bars represent standard deviation. Background correction was not performed.

