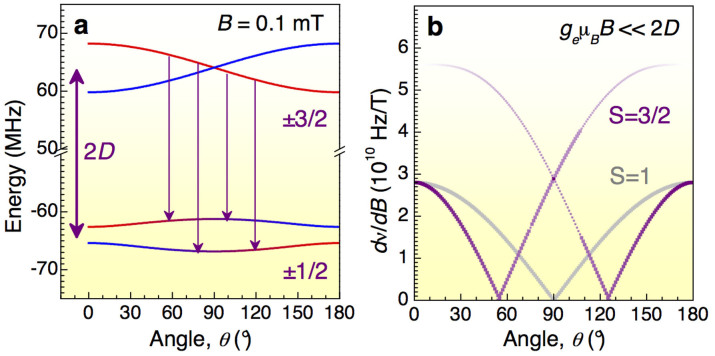
Figure 2. Vector magnetometry.
(a) Zeeman splitting of the ±3/2 (upper) and ±1/2 (lower) spin sublevels as a function of the angle θ between magnetic field B = 0.1 mT and the defect symmetry axis (2D = 128 MHz). The arrows indicate four possible RF-induced transitions. (b) Comparison of the relative shifts of the spin resonance frequencies dν/dB as a function of θ for S = 1 and S = 3/2.

